
RRN Science Workflows: WFI Data Analysis#
This science workflow guides users through the discovery and access of data while working in the cloud, as well as the visualization and analysis of Roman WFI data products. While the current workflow focuses primarily on simulated imaging data, it includes an introductory spectroscopic example and a ground-test analysis use case.
Workflow Description#
-
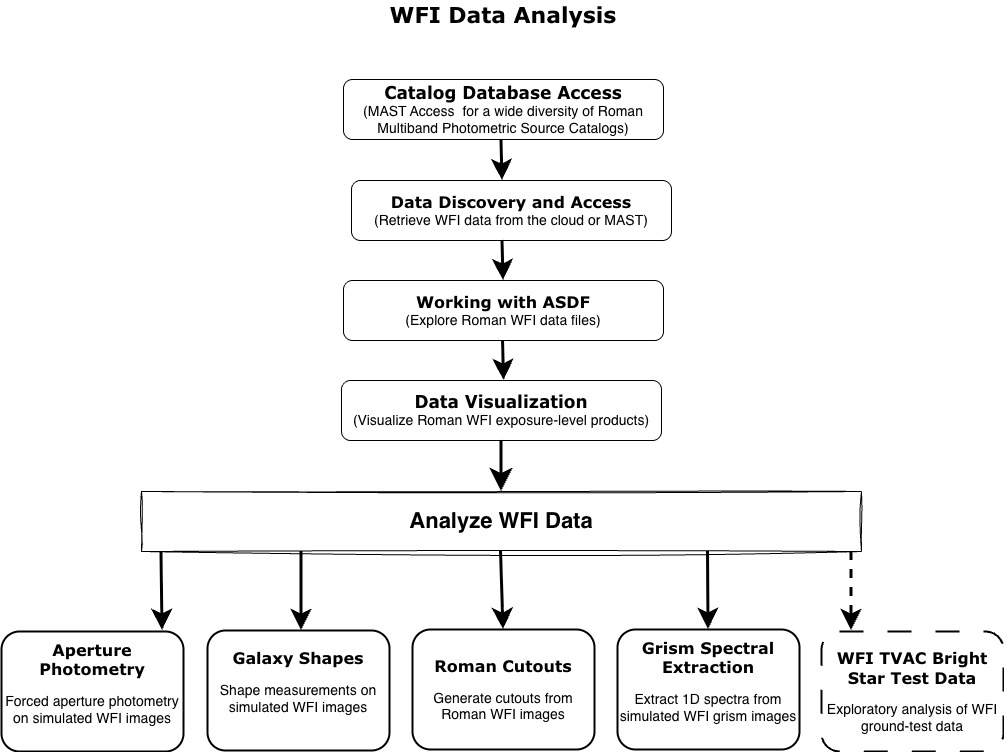
Access and query, from MAST databases, a wide diversity of Roman multiband photometric source catalogs from WFI imaging; spectral catalogs derived from WFI grism and prism spectroscopy; microlensing event variability and light curve catalogs; and Project Infrastructure team created catalogs, enabling efficient filtering and sample selection across both spatial location and miriad other properties
-
Retrieve WFI simulated images from the cloud or access data from active missions (e.g. Hubble, TESS, and JWST) from MAST. Data are streamed directly into memory, removing the need for local downloads. Users can access datasets hosted by STScI MAST or simulated Roman WFI data stored in the Nexus environment. To learn more, visit the RDox pages on accessing Roman WFI data.
-
Explore Roman WFI data products stored in the Advanced Scientific Data Format (ASDF), including files generated by Roman-I-Sim. This step covers inspecting metadata, understanding data structure, and accessing image arrays. To learn more, visit the RDox pages on Roman WFI data levels and products
-
Visualize Roman WFI exposure-level products using tools such as Matplotlib and Imviz to inspect image quality and explore basic features of the data. Imviz is based on the Jupyter platform and includes built-in Astropy functionality. For additional background information, consult Imviz documentation on ReadTheDocs.
Analyze Roman WFI images: Perform example analysis tasks on WFI images, including:
Aperture photometry: Measure integrated fluxes using forced aperture photometry on simulated WFI images.
Galaxy Shapes: Perform basic galaxy shape measurements on simulated WFI images.
Roman cutouts: Use the Astrocut service to generate image cutouts from larger WFI images for focused analysis.
Grism Spectral Extraction: Extract one-dimensional spectra from simulated Roman WFI slitless grism images.
WFI TVAC Bright Star Test Data (Early Access)
An additional analysis-level tutorial demonstrates exploratory analysis of WFI Bright Star Saturation test data obtained during the WFI thermal vacuum (TVAC) campaign. This notebook shows how to process a subset of Level 1 ground-test data using RomanCal and examine saturation behavior and frame-level effects near bright sources.
This tutorial serves as a placeholder for a more comprehensive TVAC-focused workflow. A complete WFI TVAC science workflow, integrating additional ground-test datasets and analysis steps, is currently in development and will be released in a future update
Caveat and limitations#
While the current workflow primarily focuses on WFI imaging investigations, it includes an introductory spectroscopic example and a ground-test analysis use case. Expanded spectroscopic and TVAC-focused content will be added in future releases.
Last Updated: December 2025