
Understanding the Roman WFI Saturation Reference File#
Kernel Information and Read-Only Status#
To run this notebook, please select “Roman Research Nexus {VERSION}” kernel at the top right of your window. For example “Roman Research Nexus 2026.2”.
This notebook is read-only. You can run cells and make edits, but you must save changes to a different location. We recommend saving the notebook within your home directory, or to a new folder within your home (e.g. file > save notebook as > my-nbs/nb.ipynb). Note that a directory must exist before you attempt to add a notebook to it.
Introduction#
The purpose of this notebook is to understand the the content and purpose of the Saturation Threshold (SATURATION) reference file.
The SATURATION reference provides a per-pixel saturation threshold (in DN).
During RomanCal processing, the SATURATION file is used in the saturation step to populate an array called groupdq in the science exposure. The step compares science data values against these thresholds and sets the SATURATED DQ flag (bit 1, value 2) when exceeded.
For more details, see the romancal documentation and Rdox documentation for SATURATION detection.
More details about this and other reference files can be found in the Reference File Information
Local Run Settings#
If you want to run the notebook in your local machine, refer to the information in local installation instructions before proceeding with the notebook. The instructions provide inportant information about setting up your environment and installing dependnecies.
Imports#
Libraries used:
astropy for image normalization
copy for making copies of Python objects
crds for access to calibration reference files
matplotlib and mpl_toolkits for plotting images
numpy for array manipulation
roman_datamodels for opening Roman WFI ASDF files
os for operating system functions
import os
from astropy.visualization import simple_norm
import copy

import matplotlib.pyplot as plt
from matplotlib import colors, colormaps as cm
from mpl_toolkits.axes_grid1 import make_axes_locatable
import numpy as np
import roman_datamodels as rdm
The Calibration Reference Data System (CRDS)#
The reference files, developed and validated by STScI’s Science Operations Center, are continually updated as new WFI data become available. For more information about how CRDS works and how it assigns the most appropriate reference file for each calibration step, refer to the notebook Understanding CRDS and How to Select Calibration Reference files.
IMPORTANT NOTE: Reference files are a work in progress and will be updated several times before Roman launch. If you notice irregularities or missing information, please understand that they may be a known issue. If you have questions, please contact the Roman Help Desk.
import crds
Now let’s dive into this reference file.
Let’s check the environmental variables set for CRDS
print(f"CRDS server location: {os.environ.get('CRDS_SERVER_URL')}")
print(f"CRDS context file: {os.environ.get('CRDS_CONTEXT')}")
CRDS server location: https://roman-crds.stsci.edu
CRDS context file: roman-edit
If we want to change the context, we can do it in the next cell. In this case, we choose context roman_0058.pmap.
os.environ['CRDS_CONTEXT']='roman_0058.pmap'
Retrieving Reference Files#
As you run the exposure pipeline, the most up-to-date reference files will be automatically selected for each step. However, if you would like to use a specific reference file, retrieve it using the CRDS Python API and feed it to the Exposure Level Pipeline, see the notebook Understanding CRDS and How to Select Calibration Reference files for more details.
For the saturation files in particular, the required keywords are:
ROMAN.META.INSTRUMENT.NAME
ROMAN.META.INSTRUMENT.DETECTOR
ROMAN.META.EXPOSURE.START_TIME
These keywords may be combined into a single dictionary to find and download the file using crds.getreferences().
meta = {'ROMAN.META.INSTRUMENT.NAME': 'WFI',
        'ROMAN.META.INSTRUMENT.DETECTOR': 'WFI01',
        'ROMAN.META.EXPOSURE.START_TIME': '2026-01-01 00:00:00'
       }

ref_files = crds.getreferences(meta, reftypes=['saturation'], observatory='roman')
ref_files
CRDS - INFO - Syncing 30 files
CRDS - INFO - Fetching /home/runner/crds_cache/mappings/roman/roman_wfi_specpsf_0001.rmap 572 bytes (1 / 30 files) (0 / 77.6 K bytes)
CRDS - INFO - Fetching /home/runner/crds_cache/mappings/roman/roman_wfi_skycells_0002.rmap 712 bytes (2 / 30 files) (572 / 77.6 K bytes)
CRDS - INFO - Fetching /home/runner/crds_cache/mappings/roman/roman_wfi_sflat_0001.rmap 548 bytes (3 / 30 files) (1.3 K / 77.6 K bytes)
CRDS - INFO - Fetching /home/runner/crds_cache/mappings/roman/roman_wfi_saturation_0003.rmap 2.4 K bytes (4 / 30 files) (1.8 K / 77.6 K bytes)
CRDS - INFO - Fetching /home/runner/crds_cache/mappings/roman/roman_wfi_relflux_0001.rmap 555 bytes (5 / 30 files) (4.3 K / 77.6 K bytes)
CRDS - INFO - Fetching /home/runner/crds_cache/mappings/roman/roman_wfi_refpix_0003.rmap 2.3 K bytes (6 / 30 files) (4.8 K / 77.6 K bytes)
CRDS - INFO - Fetching /home/runner/crds_cache/mappings/roman/roman_wfi_readnoise_0006.rmap 3.4 K bytes (7 / 30 files) (7.1 K / 77.6 K bytes)
CRDS - INFO - Fetching /home/runner/crds_cache/mappings/roman/roman_wfi_photom_0004.rmap 2.3 K bytes (8 / 30 files) (10.5 K / 77.6 K bytes)
CRDS - INFO - Fetching /home/runner/crds_cache/mappings/roman/roman_wfi_optmodel_0001.rmap 586 bytes (9 / 30 files) (12.9 K / 77.6 K bytes)
CRDS - INFO - Fetching /home/runner/crds_cache/mappings/roman/roman_wfi_matable_0004.rmap 690 bytes (10 / 30 files) (13.4 K / 77.6 K bytes)
CRDS - INFO - Fetching /home/runner/crds_cache/mappings/roman/roman_wfi_mask_0003.rmap 2.3 K bytes (11 / 30 files) (14.1 K / 77.6 K bytes)
CRDS - INFO - Fetching /home/runner/crds_cache/mappings/roman/roman_wfi_linearity_0005.rmap 2.4 K bytes (12 / 30 files) (16.4 K / 77.6 K bytes)
CRDS - INFO - Fetching /home/runner/crds_cache/mappings/roman/roman_wfi_ipc_0003.rmap 3.3 K bytes (13 / 30 files) (18.8 K / 77.6 K bytes)
CRDS - INFO - Fetching /home/runner/crds_cache/mappings/roman/roman_wfi_inverselinearity_0005.rmap 2.6 K bytes (14 / 30 files) (22.1 K / 77.6 K bytes)
CRDS - INFO - Fetching /home/runner/crds_cache/mappings/roman/roman_wfi_integralnonlinearity_0002.rmap 2.8 K bytes (15 / 30 files) (24.7 K / 77.6 K bytes)
CRDS - INFO - Fetching /home/runner/crds_cache/mappings/roman/roman_wfi_gain_0003.rmap 2.3 K bytes (16 / 30 files) (27.5 K / 77.6 K bytes)
CRDS - INFO - Fetching /home/runner/crds_cache/mappings/roman/roman_wfi_flat_0006.rmap 8.5 K bytes (17 / 30 files) (29.7 K / 77.6 K bytes)
CRDS - INFO - Fetching /home/runner/crds_cache/mappings/roman/roman_wfi_etc_0002.rmap 2.3 K bytes (18 / 30 files) (38.2 K / 77.6 K bytes)
CRDS - INFO - Fetching /home/runner/crds_cache/mappings/roman/roman_wfi_epsf_0004.rmap 16.3 K bytes (19 / 30 files) (40.5 K / 77.6 K bytes)
CRDS - INFO - Fetching /home/runner/crds_cache/mappings/roman/roman_wfi_dustmap_0003.rmap 855 bytes (20 / 30 files) (56.8 K / 77.6 K bytes)
CRDS - INFO - Fetching /home/runner/crds_cache/mappings/roman/roman_wfi_distortion_0002.rmap 3.6 K bytes (21 / 30 files) (57.7 K / 77.6 K bytes)
CRDS - INFO - Fetching /home/runner/crds_cache/mappings/roman/roman_wfi_detectorstatus_0002.rmap 773 bytes (22 / 30 files) (61.2 K / 77.6 K bytes)
CRDS - INFO - Fetching /home/runner/crds_cache/mappings/roman/roman_wfi_darkdecaysignal_0002.rmap 783 bytes (23 / 30 files) (62.0 K / 77.6 K bytes)
CRDS - INFO - Fetching /home/runner/crds_cache/mappings/roman/roman_wfi_dark_0011.rmap 4.4 K bytes (24 / 30 files) (62.8 K / 77.6 K bytes)
CRDS - INFO - Fetching /home/runner/crds_cache/mappings/roman/roman_wfi_area_0002.rmap 2.3 K bytes (25 / 30 files) (67.2 K / 77.6 K bytes)
CRDS - INFO - Fetching /home/runner/crds_cache/mappings/roman/roman_wfi_apcorr_0003.rmap 2.3 K bytes (26 / 30 files) (69.5 K / 77.6 K bytes)
CRDS - INFO - Fetching /home/runner/crds_cache/mappings/roman/roman_wfi_abvegaoffset_0002.rmap 2.5 K bytes (27 / 30 files) (71.8 K / 77.6 K bytes)
CRDS - INFO - Fetching /home/runner/crds_cache/mappings/roman/roman_wfi_absflux_0001.rmap 555 bytes (28 / 30 files) (74.3 K / 77.6 K bytes)
CRDS - INFO - Fetching /home/runner/crds_cache/mappings/roman/roman_wfi_0056.imap 2.4 K bytes (29 / 30 files) (74.8 K / 77.6 K bytes)
CRDS - INFO - Fetching /home/runner/crds_cache/mappings/roman/roman_0058.pmap 344 bytes (30 / 30 files) (77.3 K / 77.6 K bytes)
CRDS - INFO - Syncing 1 files
CRDS - INFO - Fetching /home/runner/crds_cache/references/roman/wfi/roman_wfi_saturation_0031.asdf 134.2 M bytes (1 / 1 files) (0 / 134.2 M bytes)
{'saturation': '/home/runner/crds_cache/references/roman/wfi/roman_wfi_saturation_0031.asdf'}
Examining Reference Files#
Reference files use roman_datamodels just like WFI science data products and can be accessed in the same way (see the tutorial Working with ASDF for more information). Let’s take a closer look at the files we retrieved from our crds.getreferences() example starting with the mask file:
saturation = rdm.open(ref_files['saturation'])
saturation.info()
root (AsdfObject)
├─asdf_library (Software)
│ ├─author (str): The ASDF Developers
│ ├─homepage (str): http://github.com/asdf-format/asdf
│ ├─name (str): asdf
│ └─version (str): 4.1.0
├─history (AsdfDictNode)
│ └─extensions (AsdfListNode)
│   ├─0 (ExtensionMetadata) ...
│   ├─1 (ExtensionMetadata) ...
│   └─2 (ExtensionMetadata) ...
└─roman (SaturationRef) # Saturation Reference File Schema
  ├─meta (AsdfDictNode) # Common Reference File Metadata Properties
  │ ├─author (str): Timothy Brandt # Author
  │ ├─description (str): Saturation reference file derived from TVAC1 data Updated to Build 17 versions of r (truncated)
  │ ├─instrument (AsdfDictNode) ...
  │ ├─origin (Origin): STSCI # Institution / Organization Name
  │ ├─pedigree (str): GROUND # Pedigree
  │ ├─reftype (str): SATURATION
  │ ├─telescope (Telescope): ROMAN # Telescope Name
  │ └─useafter (Time): 2023-08-01T00:00:00.000 # Use After Date
  ├─data (NDArrayType) # Saturation Threshold Array ...
  └─dq (NDArrayType) # 2-D Data Quality Array ...
Some nodes not shown.
We see that the SATURATION file contains metadata and a data and dq arrays. For this file, the data array contains the Saturation Thresholds.
Let’s take a look at the saturation data for this detector. First, lets check the shape of the data array:
print("saturation.data shape:", saturation.data.shape)
print("saturation.dq shape:", saturation.dq.shape)
saturation.data shape: (4096, 4096)
saturation.dq shape: (4096, 4096)
Now lets get some basic statistics on the cube (or a representative slice)
print("sat.data shape:", saturation.data.shape)
print("sat.dq shape:", saturation.dq.shape)

# Quick stats on saturation thresholds
data = saturation.data
print("\nSaturation threshold stats:")
print("  Min:", data.min(), "Max:", data.max())
print("  Mean:", data.mean(), "Median:", np.median(data))
print("  Std:", data.std())

# DQ stats
dq = saturation.dq
total = dq.size
flagged = np.sum(dq > 0)
print(f"\nDQ: {flagged:,} / {total:,} pixels flagged ({flagged/total*100:.3f}%)")
sat.data shape: (4096, 4096)
sat.dq shape: (4096, 4096)

Saturation threshold stats:
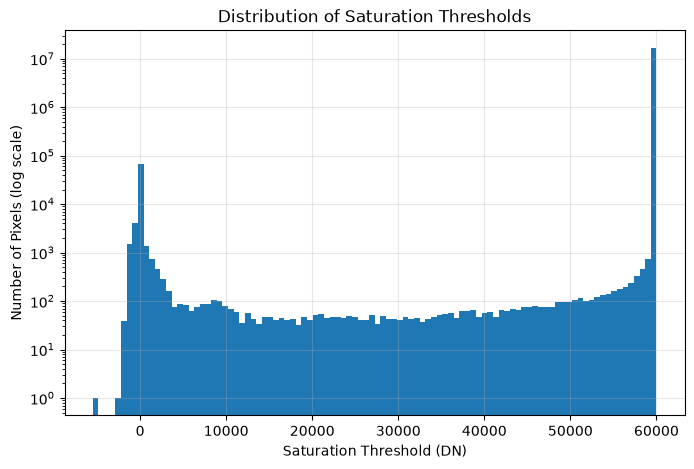
  Min: -5500.0 Max: 60000.0
  Mean: 59715.348 Median: 60000.0
  Std: 4095.807

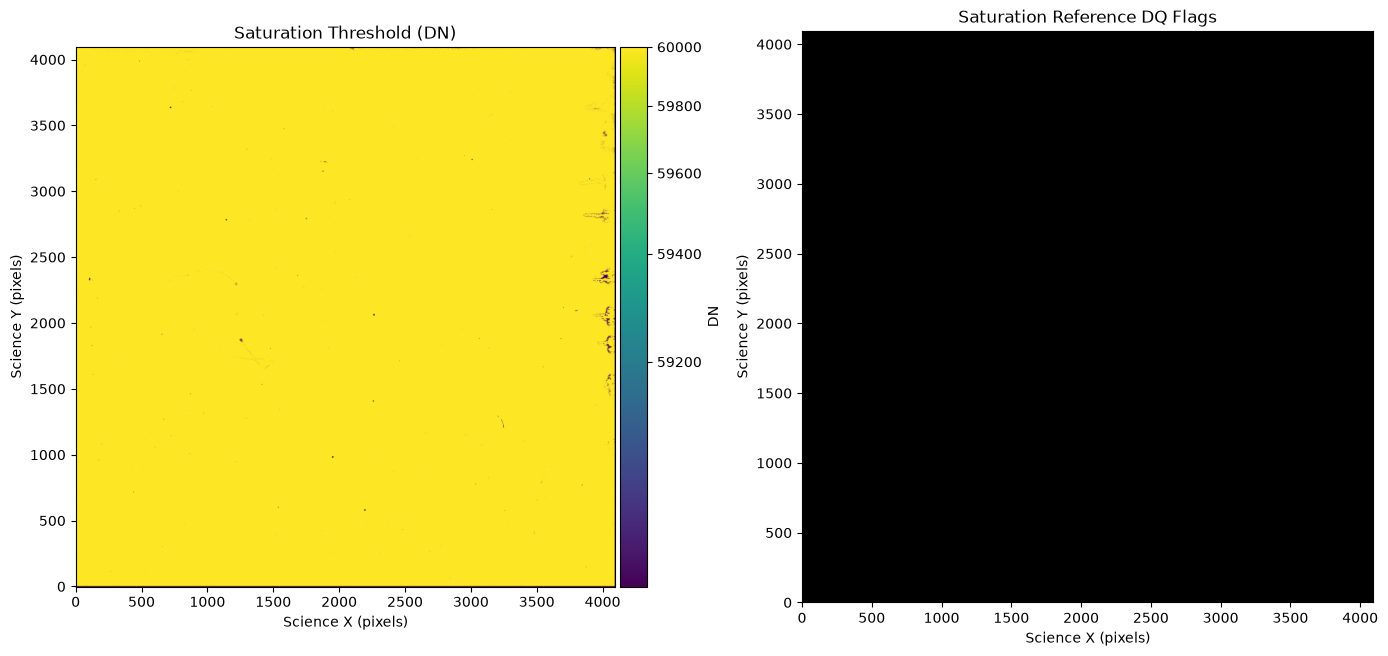
DQ: 0 / 16,777,216 pixels flagged (0.000%)
Now lets get a histobran of the saturation threshold values
plt.figure(figsize=(8, 5))
plt.hist(saturation.data.flatten(), bins=100, log=True)
plt.xlabel('Saturation Threshold (DN)')
plt.ylabel('Number of Pixels (log scale)')
plt.title('Distribution of Saturation Thresholds')
plt.grid(True, alpha=0.3)
plt.show()
Now, let’s plot two versions of the file, one with ethe threshold map and another flattened version with DQ map:
fig, axs = plt.subplots(1, 2, figsize=(14, 7))

# Saturation threshold map
norm = simple_norm(saturation.data, stretch='sqrt', percent=99)
im0 = axs[0].imshow(saturation.data, cmap='viridis', norm=norm, origin='lower')
axs[0].set_title('Saturation Threshold (DN)')
divider = make_axes_locatable(axs[0])
cax = divider.append_axes("right", size="5%", pad=0.05)
fig.colorbar(im0, cax=cax, label='DN')

# DQ map
axs[1].imshow(np.bool_(saturation.dq), cmap='binary_r', origin='lower')
axs[1].set_title('Saturation Reference DQ Flags')

for ax in axs:
    ax.set_xlabel('Science X (pixels)')
    ax.set_ylabel('Science Y (pixels)')

plt.tight_layout()
plt.show()
About this Notebook#
Author: R. Diaz
Updated On: 2026-07-06
| Top of page |

|

|