The release of Jdaviz 4.0 happened this week! Woohoo!
Jdaviz is an open source Python package developed to visualize and analyse data from the James Webb Space Telescope (JWST). Its user interface can be used in Jupyter Notebooks, as a stand-alone application, or embedded in webpages (like our dear MAST does!) and it is designed to provide visualization and analysis machinery for both spectra and imaging.
This week, the team released version 4.0 which carries major updates. Cubeviz (the Jdaviz configuration for cube data) is now equipped with a fully featured spectral extraction plugin. This enables you to do exact extraction of fractional pixels, background subtraction, and unit conversion. Unit conversion is especially useful for cubes in surface brightness, like those from JWST.
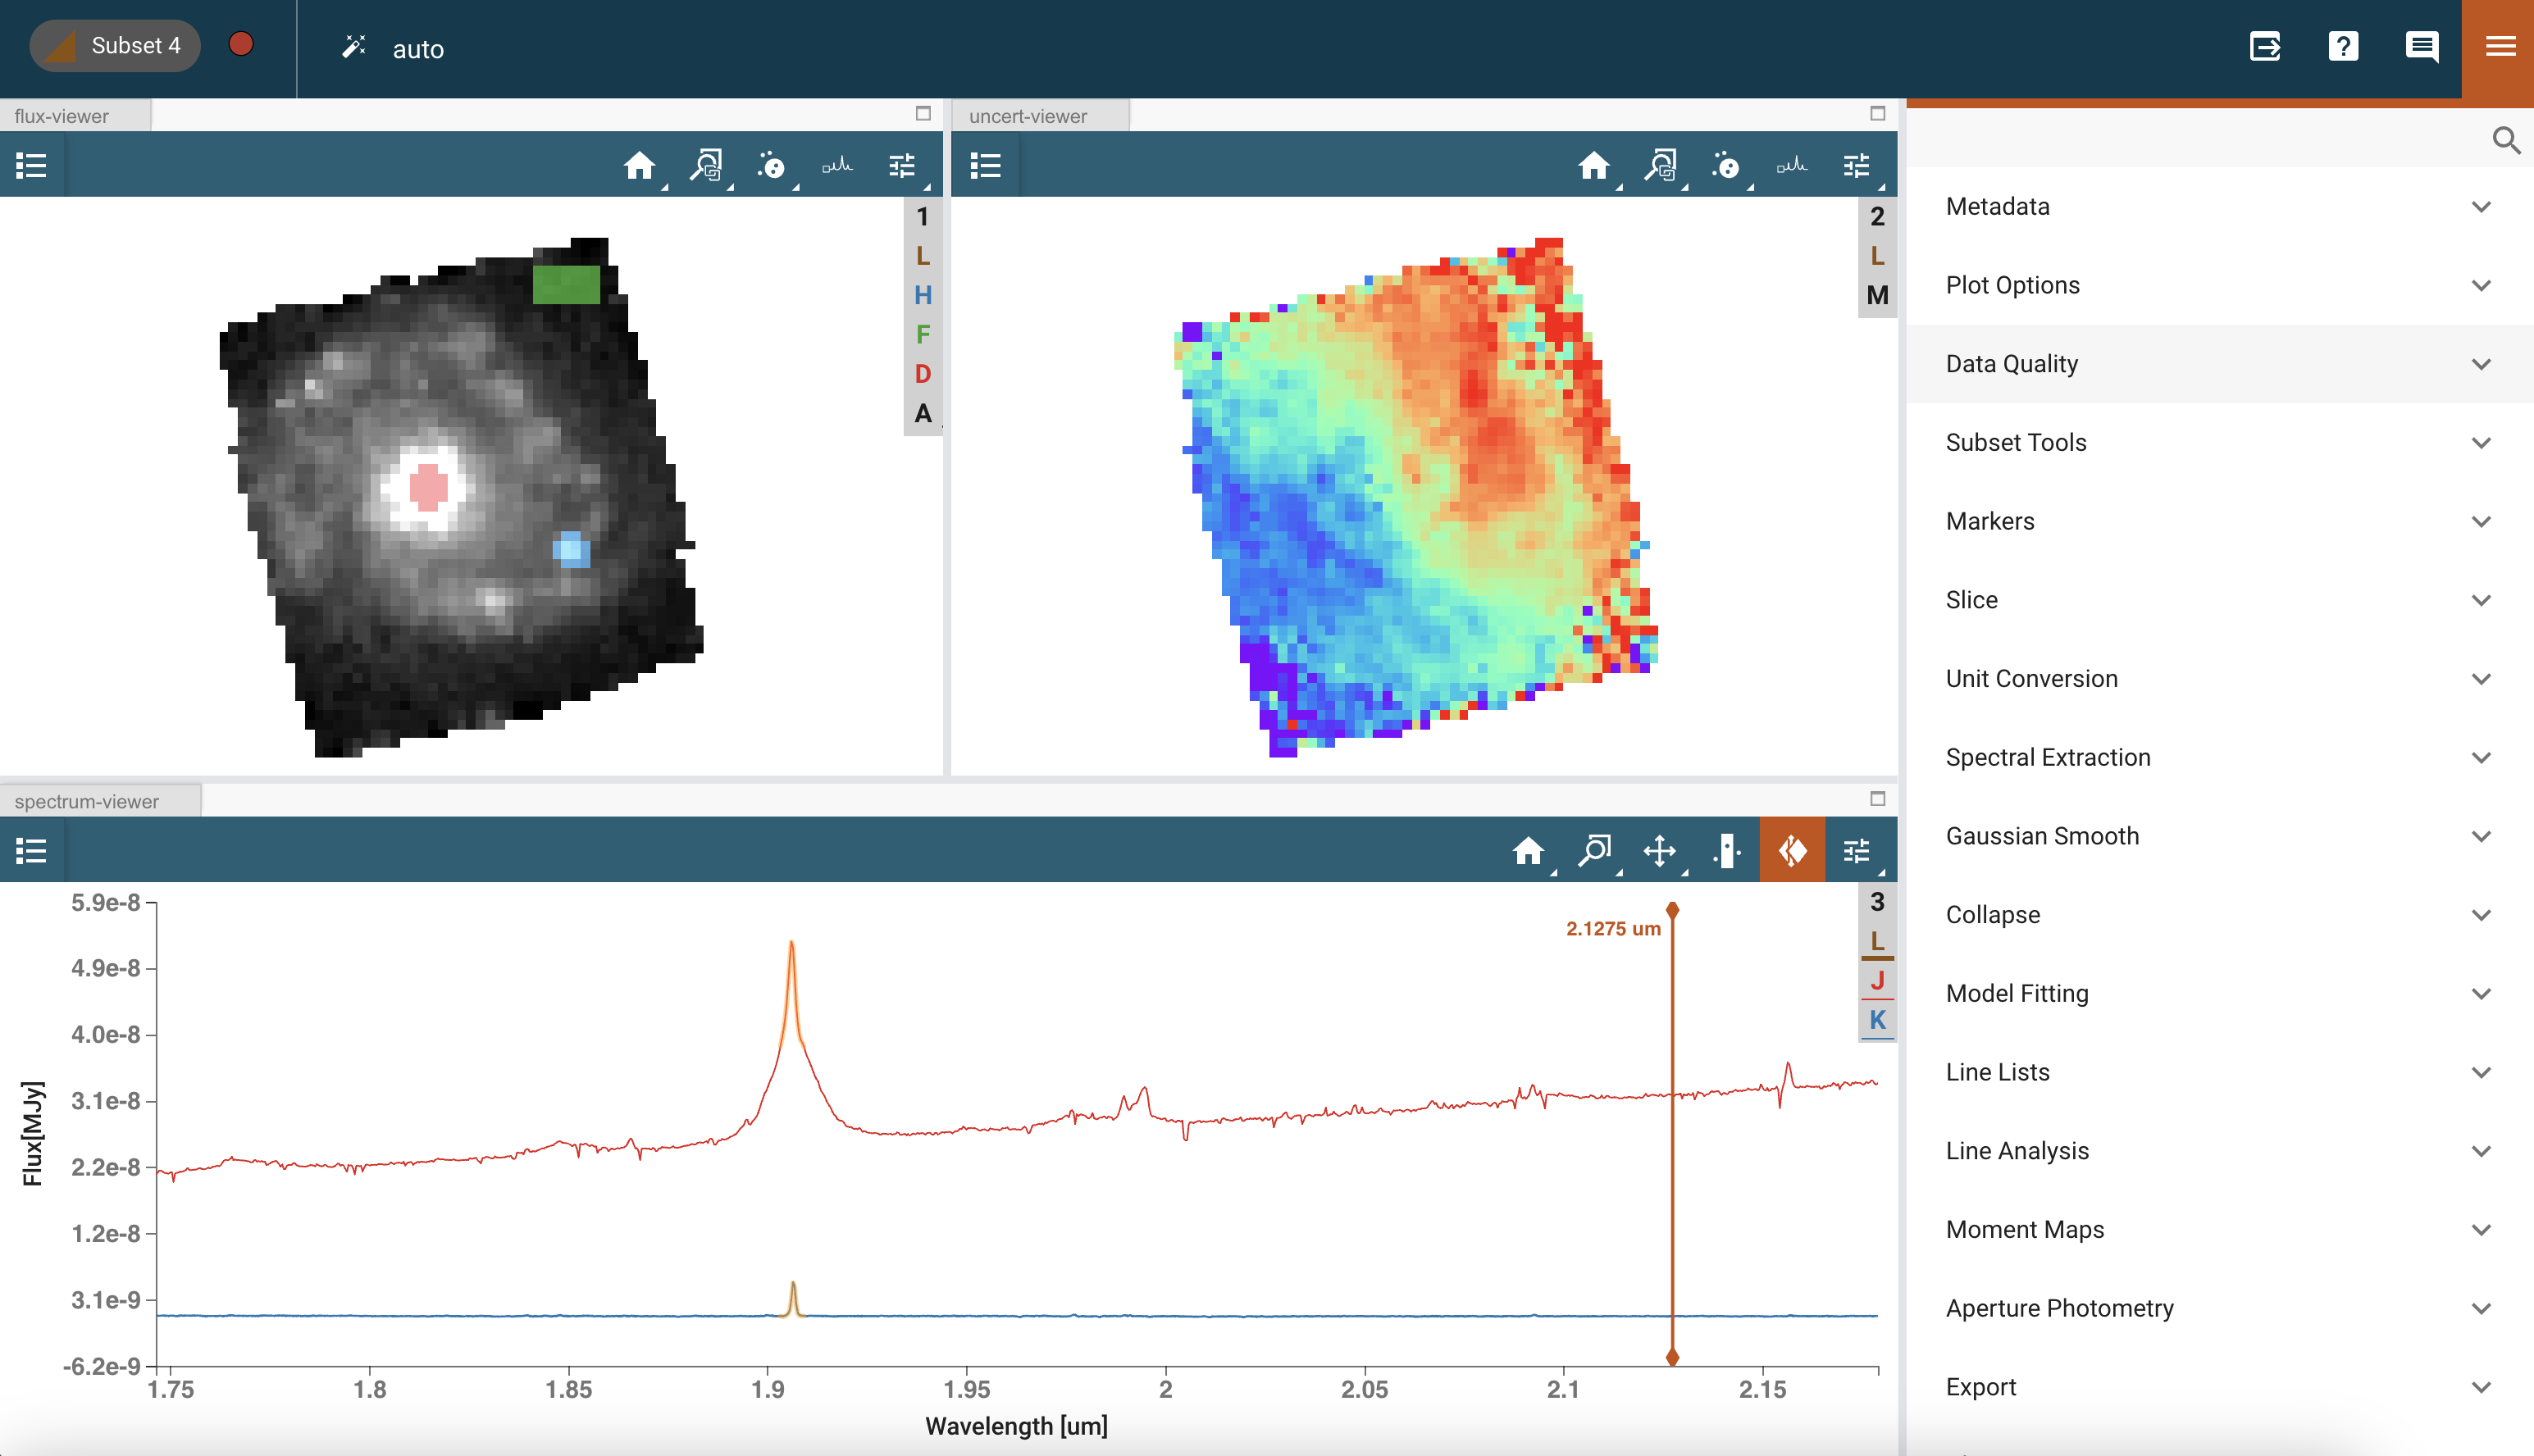
The image shows the cube of NGC7469, a galaxy with an active galactic nucleus in the center, observed as part of program 1328. The top left viewer shows the flux cube at 2.13 micron and the three spatial subsets used for the analysis. The top right viewer shows the calculated velocity map of the Paschen-alpha line obtained with the Moment Map plugin. The bottom viewer shows the spectra extracted in the center (red spectrum) and in the outskirt clump (blue spectrum) using the newly updated Spectral Extraction plugin. To the right, the plugin tray is open, showing all the visualization and analysis plugins available in the tool.
The other big update in Jdaviz 4.0 is the introduction of Solara to replace Voila for the rendering of the stand-alone application. I will not go into the details and technicalities of this swap here, but I will note that this results in better performance and cleaner code on the Jdaviz side.
The release of 4.0 carries also bug fixes and performance improvements throughout the app. In particular, the “Export” plugin now allows you to export:
- quantities calculated in the other plugins (e.g., the results of Aperture Photometry) in table format
- defined regions of interests or subsets in table format, and
- generated products (e.g., analytic models fitted to observed spectra or moment maps fitted to cube data) in FITS format
To give it a try, installation instruction can be found in the documentation online and as always the team can be contacted via github issues or help desk calls. Whether you have JWST data or other data, enjoy!
Written by: Cami Pacifici
MAST
We are the Barbara A. Mikulski Archive for Space Telescopes! Primarily focused on the optical, ultraviolet, and near-infrared, we host data from Hubble, JWST, and over two dozen other missions.