Last year, STRAUSS and Jdaviz started a collaboration to sonify astronomical data and open up a whole new way of interacting specifically with 3D cubes. Today, STRAUSS+Jdaviz won a prize for the 2025 sonification awards!
What is STRAUSS?
STRAUSS is a Python toolkit for the representation of data into sound with both scientific and outreach applications. It can be used to enhance visual representations or for accessibility for visually impaired users.
STRAUSS is intended to be straightforward, but also flexible enough to allow for detailed control over the sonification process. The project is described in more detail in the paper Introducing STRAUSS: a flexible sonification Python package.
How is STRAUSS integrated in Jdaviz?
Jdaviz is a Python package to visualize and analyze imaging and spectroscopic astronomical data. 3D dataset (or cubes) are a combination of imaging and spectroscopy. In practice, for every pixel in an image, a spectrum spanning a given wavelength range is available. Exploring cube data can be challenging and Jdaviz includes a specific configuration for this type of data: Cubeviz.
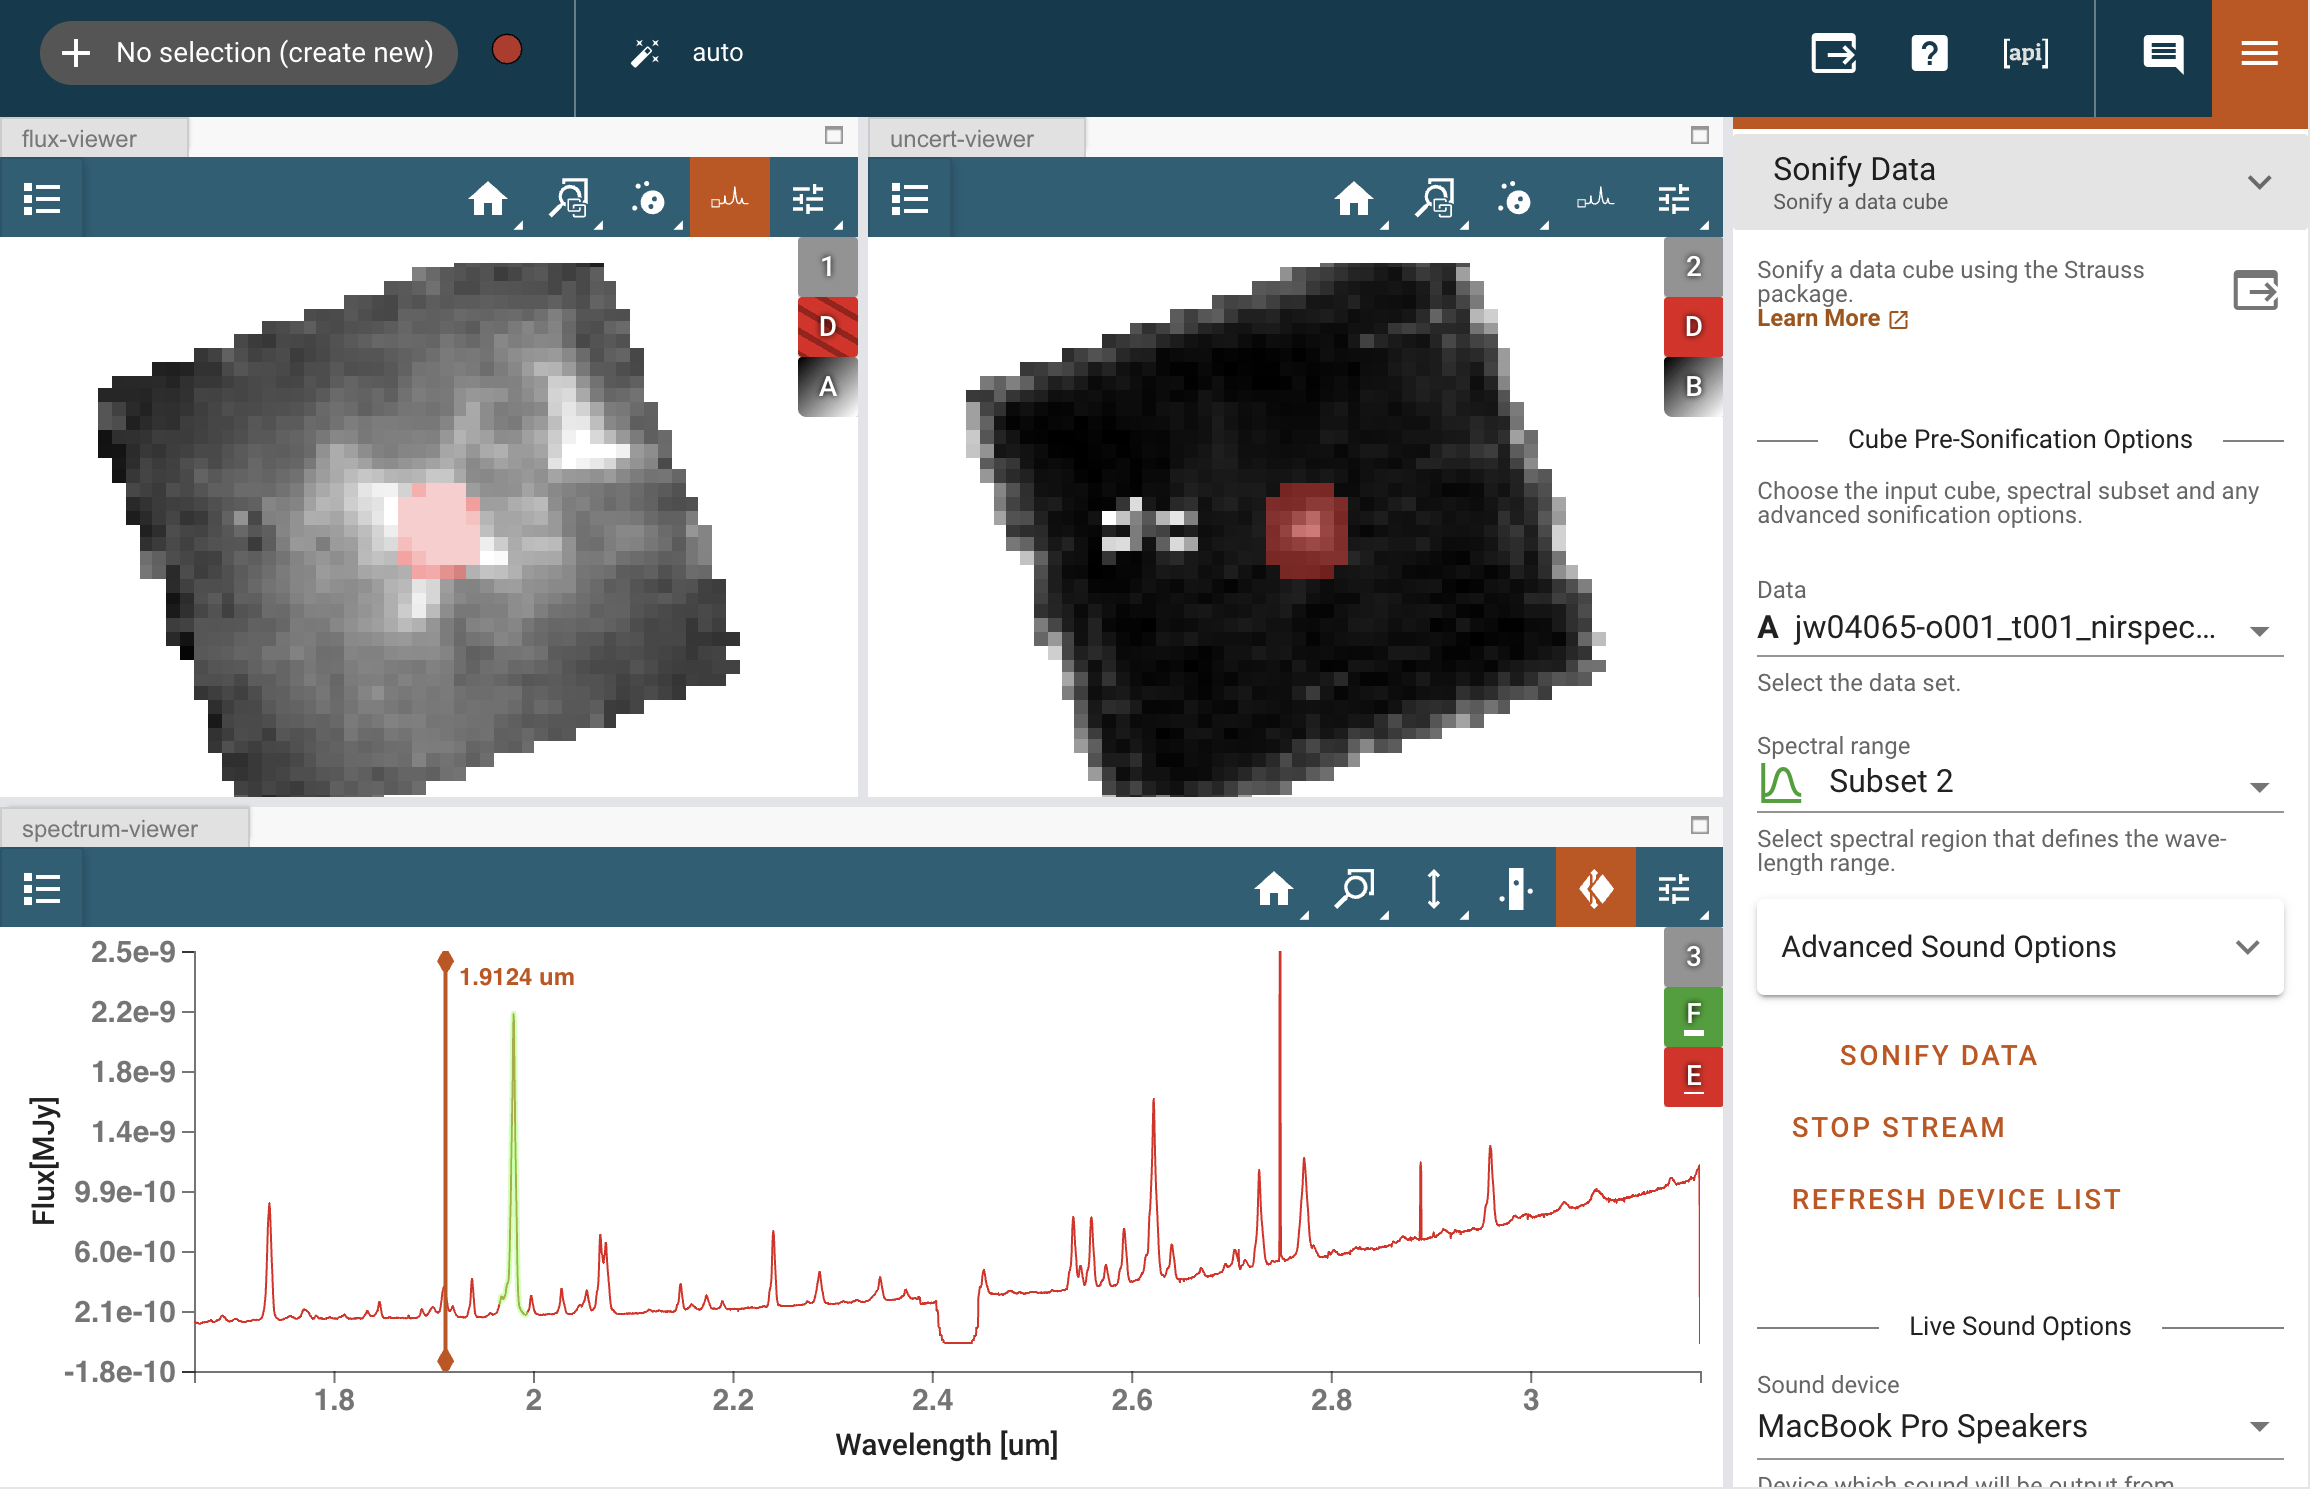 Cubeviz interface showing a JWST/NIRSpec cube from program 4065. The flux viewer (top left) and the uncertainty viewer (top right)
show the cube at a wavelength of 1.92 microns. The bottom viewer shows the extracted spectrum from the region marked
in red in the flux viewer. The green region in the spectrum viewer is used for data sonification.
The plugin tray to the right is open on the Sonify Data plugin.
Cubeviz interface showing a JWST/NIRSpec cube from program 4065. The flux viewer (top left) and the uncertainty viewer (top right)
show the cube at a wavelength of 1.92 microns. The bottom viewer shows the extracted spectrum from the region marked
in red in the flux viewer. The green region in the spectrum viewer is used for data sonification.
The plugin tray to the right is open on the Sonify Data plugin.
The STRAUSS and Jdaviz teams worked together to build a plugin in Cubeviz to sonify data. In practice, the user can choose the whole spectrum or a specific wavelength range of interest along with a set of advanced sound options (e.g., minimum and maximum audio frequency, volume index, flux percentile cut) to produce a grid of sounds that correspond to features in the data. By moving the cursor on the image, the user is able to hear differences in the sound, for example in pitch, mapping the position of a specific feature in wavelength, tand in volume, mapping the intensity of a specific feature.
Try it out!
To be able to run the sonification plugin on cubes you just need to install jdaviz and strauss using pip in the same virtual environment on your machine. If you have any comments, questions, or requests you can reach the team on Github or through the
JWST help desk.
Written by: Cami Pacifici
MAST
We are the Barbara A. Mikulski Archive for Space Telescopes! Primarily focused on the optical, ultraviolet, and near-infrared, we host data from Hubble, JWST, and over two dozen other missions.