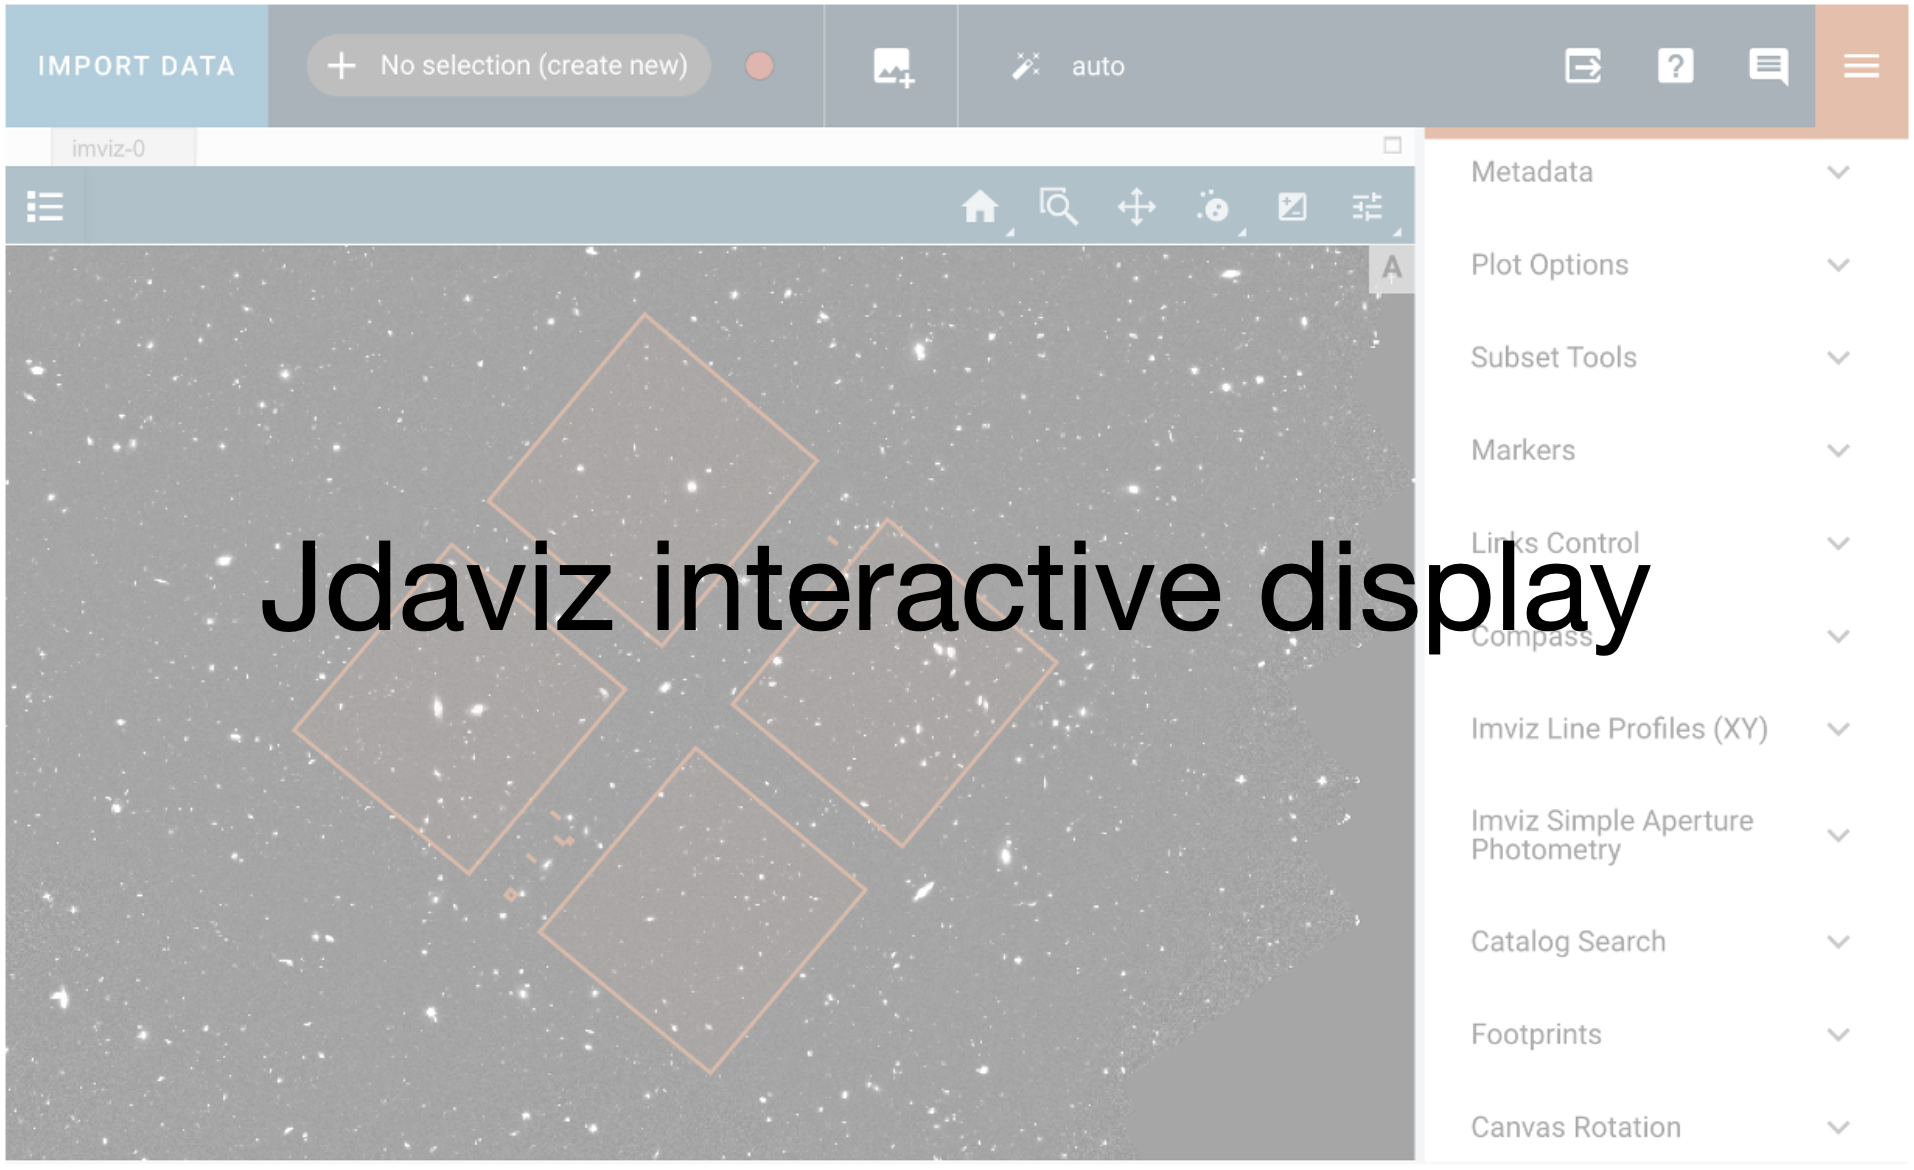
RGB images with Imviz#
Use case: create RGB images using Imviz programmatically.
Data: Carina Nebula, NIRCam observations
Tools: jdaviz
Cross-intrument: Any imager
Documentation: This notebook is part of a STScI’s larger post-pipeline Data Analysis Tools Ecosystem.
For additional resources, please review our provided full example notebooks maintained in the Jdaviz repository: https://github.com/spacetelescope/jdaviz/tree/main/notebooks
Import modules needed for this notebook:
import warnings

from astroquery.mast import Observations

from jdaviz import Imviz
We create an Imviz instance and grab the default viewer instance as well:
imviz = Imviz()
Let’s download some data. The images are quite large. The download will take a few minutes.
data_dir = '.'

files = ['jw02731-o001_t017_nircam_clear-f090w_i2d.fits',
         'jw02731-o001_t017_nircam_clear-f187n_i2d.fits',
         'jw02731-o001_t017_nircam_clear-f200w_i2d.fits',
         'jw02731-o001_t017_nircam_clear-f335m_i2d.fits',
         'jw02731-o001_t017_nircam_clear-f444w_i2d.fits',
         'jw02731-o001_t017_nircam_f444w-f470n_i2d.fits']

for fn in files:
    uri = f"mast:JWST/product/{fn}"
    result = Observations.download_file(uri, local_path=f'{data_dir}/{fn}')
Downloading URL https://mast.stsci.edu/api/v0.1/Download/file?uri=mast:JWST/product/jw02731-o001_t017_nircam_clear-f090w_i2d.fits to ./jw02731-o001_t017_nircam_clear-f090w_i2d.fits ... [Done]
Downloading URL https://mast.stsci.edu/api/v0.1/Download/file?uri=mast:JWST/product/jw02731-o001_t017_nircam_clear-f187n_i2d.fits to ./jw02731-o001_t017_nircam_clear-f187n_i2d.fits ... [Done]
Downloading URL https://mast.stsci.edu/api/v0.1/Download/file?uri=mast:JWST/product/jw02731-o001_t017_nircam_clear-f200w_i2d.fits to ./jw02731-o001_t017_nircam_clear-f200w_i2d.fits ... [Done]
Downloading URL https://mast.stsci.edu/api/v0.1/Download/file?uri=mast:JWST/product/jw02731-o001_t017_nircam_clear-f335m_i2d.fits to ./jw02731-o001_t017_nircam_clear-f335m_i2d.fits ... [Done]
Downloading URL https://mast.stsci.edu/api/v0.1/Download/file?uri=mast:JWST/product/jw02731-o001_t017_nircam_clear-f444w_i2d.fits to ./jw02731-o001_t017_nircam_clear-f444w_i2d.fits ... [Done]
Downloading URL https://mast.stsci.edu/api/v0.1/Download/file?uri=mast:JWST/product/jw02731-o001_t017_nircam_f444w-f470n_i2d.fits to ./jw02731-o001_t017_nircam_f444w-f470n_i2d.fits ... [Done]
And load into Imviz.
with warnings.catch_warnings():
    warnings.simplefilter('ignore')
    with imviz.batch_load():
        for fn in files:
            imviz.load_data(f'{data_dir}/{fn}', data_label=fn[31:36])
Now, we can display Imviz.
imviz.show()

WCS Linking Controls#
https://jdaviz.readthedocs.io/en/latest/imviz/plugins.html#link-control
The first thing you will probably notice is that the image doesn’t take up the entire viewer area. If you press the “b” key to blink to the next image, you will see that this image is zoomed correctly by default. The odd default zoom on the other is because the images are linked by pixel when loaded. We can instead link by WCS (world coordinates) so that the images will be properly aligned.
There are two ways to link in Imviz. Firstly, you can do it from within the UI through the Links Control plugin by selecting “WCS”. Either open the plugin tray to the right and search for “Links Control”, or execute the following cell to open it automatically:
imviz.plugins['Links Control'].open_in_tray()
You can also set the link type from the API using the Imviz Helper:
# Link images by WCS (without affine approximation)
imviz.plugins['Links Control'].link_type = 'WCS'
imviz.plugins['Links Control'].wcs_use_affine = False
Now if you blink, the images should be aligned
Plot Options#
The Plot Options plugins allows you to modify how your image appears. Here, we demonstrate how to use it to create RGB images.
To show the Plot Options plugin, either search in the plugin bar, or execute the following cell to open it automatically:
plot_options = imviz.plugins['Plot Options']
plot_options.open_in_tray()
Here you can adjust the color, opacity, contrast, and bias among other things. You can adjust them manually via the UI, or programmatically via the API to make image appear as you’d like:
plot_options.image_color_mode = 'Monochromatic'
img_settings = {'f090w': {'image_color': '#cc7ace',
                          'stretch_vmax': 4,
                          'image_opacity': 0.32,
                          'image_contrast': 0.69,
                          'image_bias': 0.39},
                'f187n': {'image_color': '#66cfef',
                          'stretch_vmin': 0,
                          'stretch_vmax': 16,
                          'image_opacity': 0.4,
                          'image_contrast': 0.94,
                          'image_bias': 0.74},
                'f200w': {'image_color': '#61d3e1',
                          'stretch_vmax': 6,
                          'image_opacity': 0.31,
                          'image_contrast': 2.15,
                          'image_bias': 0.66},
                'f335m': {'image_color': '#afff6b',
                          'stretch_vmin': 4,
                          'stretch_vmax': 27,
                          'image_opacity': 0.23,
                          'image_contrast': 3.13,
                          'image_bias': 0.67},
                'f444w': {'image_color': '#ff767c',
                          'stretch_vmax': 10,
                          'image_opacity': 0.18,
                          'image_contrast': 1.77,
                          'image_bias': 0.56},
                'f470n': {'image_color': '#f7787d',
                          'stretch_vmin': 1,
                          'stretch_vmax': 11,
                          'image_opacity': 0.4,
                          'image_contrast': 2.53,
                          'image_bias': 0.27}}
We can now iterate over this dictionary of settings and use the plot options API to set each of the options.
for layer, settings in img_settings.items():
    plot_options.layer = f'{layer}[DATA]'
    for k, v in settings.items():
        setattr(plot_options, k, v)
And lastly, we can save to an image using the export plot plugin.
imviz.plugins['Export Plot'].save_figure('carina_rgb.png')

Notebook created by Kyle Conroy and adapted by Duy Nguyen and Camilla Pacifici.
