TWEAKREG Tips - Using DS9 Regions for Source Inclusion/Exclusion#
Table of Contents#
2. Use TweakReg to create source catalogs
6. Combining exclusions and inclusion regions
Introduction#
SAOImageDS9 (DS9) is a popular image visualization program used in astronomy. DS9 regions are interactive, user generated shapes which mark areas of interest on an astronomical image. For users with no experience with DS9, many resources exist online. One such example is this AstroBites page which summarizes the most common DS9 features.
In this example we show how TweakReg can include and exclude sources identified by DS9 regions during image alignment. The use of “excluded” regions prevents spurious detections and ignores parts of the input images that might hinder a proper identification of sources for alignment. “Included” regions is particularly useful for images that have few good sources that can be used for image alignment and need all other sources not contained within these regions to be ignored.
Please direct inquires about this notebook to the HST help desk, selecting the DrizzlePac category.
Import packages#
The following Python packages are required to run the Jupyter Notebook:
os - change and make directories
glob - gather lists of filenames
shutil - remove directories and files
matplotlib - make figures and graphics
astropy - file handling, tables, units, WCS, statistics
astroquery - download data and query databases
drizzlepac - align and combine HST images
photutils - tools for detecting sources and performing photometry
regions - region handling
import os
import glob
import shutil

import matplotlib.pyplot as plt
from astropy.table import Table
from astropy.io import fits
from astroquery.mast import Observations

from drizzlepac import tweakreg
from photutils.aperture import CircularAperture
from regions import Regions

# set plotting details for notebooks
%matplotlib inline
%config InlineBackend.figure_format = 'retina' # Improves the resolution of figures rendered in notebooks.
plt.rcParams['figure.figsize'] = (20, 20)
1. Download the data#
This example uses observations of ‘MACSJ1149.5+2223-HFFPAR’ (proposal ID 13504, files jcdua3f4q_flc.fits and jcdua3f8q_flc.fits). We provide code below to retrieve the ACS/WFC calibrated FLC files.
Data are downloaded using the astroquery API to access the MAST archive. The astroquery.mast documentation has more examples for how to find and download data from MAST.
It is unusual to download individual files instead of all the related files in an association, but it can be done. First, we need to find the IDs for these two specific FLC files.
Note: astroquery uses both obs_id and obsID. Be careful not to confuse them.
# Retrieve the observation information.
obs_table = Observations.query_criteria(obs_id=['JCDUA3010', 'JCDUA3020'])

# Find obsID for specific FLC images.
product_list = Observations.get_product_list(obs_table['obsid'])
mask = (product_list['productFilename'] == 'jcdua3f4q_flc.fits') | (
    product_list['productFilename'] == 'jcdua3f8q_flc.fits')
product_list['obsID', 'productFilename'][mask]
| obsID | productFilename |
|---|---|
| str8 | str50 |
| 24127375 | jcdua3f4q_flc.fits |
| 24127376 | jcdua3f8q_flc.fits |
Based on this table, the obsID values for jcdua3f4q_flc.fits and jcdua3f8q_flc.fits are 24127375 and 24127376. We use this information to download these two FITS files.
# Download jcdua3f4q_flc.fits and jcdua3f8q_flc.fits from MAST.

products_to_download = product_list[mask]

data_prod = ['FLC']                                 # ['FLC','FLT','DRC','DRZ']
# ['CALACS','CALWF3','CALWP2','HAP-SVM']
data_type = ['CALACS']

Observations.download_products(
    products_to_download, productSubGroupDescription=data_prod, project=data_type, cache=True)
Downloading URL https://mast.stsci.edu/api/v0.1/Download/file?uri=mast:HST/product/jcdua3f4q_flc.fits to ./mastDownload/HST/jcdua3f4q/jcdua3f4q_flc.fits ...
[Done]
Downloading URL https://mast.stsci.edu/api/v0.1/Download/file?uri=mast:HST/product/jcdua3f8q_flc.fits to ./mastDownload/HST/jcdua3f8q/jcdua3f8q_flc.fits ...
[Done]
| Local Path | Status | Message | URL |
|---|---|---|---|
| str47 | str8 | object | object |
| ./mastDownload/HST/jcdua3f4q/jcdua3f4q_flc.fits | COMPLETE | None | None |
| ./mastDownload/HST/jcdua3f8q/jcdua3f8q_flc.fits | COMPLETE | None | None |
If the cell above produces an error, try running it again. Connection issues can cause errors on the first try.
# Move the files from the mastDownload directory to the current working directory.

for flc in glob.glob('mastDownload/HST/*/jcdua3f[48]q_flc.fits'):
    flc_name = os.path.split(flc)[-1]
    os.rename(flc, flc_name)

# Delete the mastDownload directory and all subdirectories it contains.
shutil.rmtree('mastDownload')
2. Use TweakReg to create source catalogs#
Run TweakReg on one of the FLC files downloaded into this directory, jcdua3f4q_flc.fits. By limiting the input list to one file TweakReg makes the source catalog for this image, but performs no matching or aligning. Using a slightly larger conv_width of 4.5 pixels (versus the default of 3.5 for ACS/WFC) means TweakReg will be able to utilize small compact objects for alignment.
Note: This notebook is only concerned with the source detection capabilities of TweakReg, and so to prevent any changes being saved to the images, the updatehdr parameter is set to False.
tweakreg.TweakReg('jcdua3f4q_flc.fits',
                  imagefindcfg=dict(threshold=50, conv_width=4.5),
                  updatehdr=False)
Setting up logfile : tweakreg.log
TweakReg Version 3.10.0 started at: 20:20:25.437 (02/12/2025)
Version Information
--------------------
Python Version 3.11.14 | packaged by conda-forge | (main, Oct 22 2025, 22:46:25) [GCC 14.3.0]
numpy Version -> 2.3.5
astropy Version -> 7.2.0
stwcs Version -> 1.7.5
photutils Version -> 2.3.0
Finding shifts for:
jcdua3f4q_flc.fits
=== Source finding for image 'jcdua3f4q_flc.fits':
# Source finding for 'jcdua3f4q_flc.fits', EXT=('SCI', 1) started at: 20:20:25.602 (02/12/2025)
Found 10334 objects.
# Source finding for 'jcdua3f4q_flc.fits', EXT=('SCI', 2) started at: 20:20:26.216 (02/12/2025)
Found 10638 objects.
=== FINAL number of objects in image 'jcdua3f4q_flc.fits': 20972
WARNING: Fewer than two images available for alignment. Quitting...
Trailer file written to: tweakreg.log
This creates four output files:
jcdua3f4q_flc_sci1_xy_catalog.coo contains the X and Y positions, flux, and IDs for all detected sources in the SCI1 extention
jcdua3f4q_flc_sci2_xy_catalog.coo contains the X and Y positions, flux, and IDs for all detected sources in the SCI2 extention
jcdua3f4q_flc_sky_catalog.coo has the RA and DEC of all the sources from both extensions
tweakreg.log is the log file output from
TweakReg
Read in the the SCI1 catalog file and print the first 5 rows to show the column names.
# Read in the SCI1 catalog file
coords_tab = Table.read('jcdua3f4q_flc_sci1_xy_catalog.coo',
                        format='ascii.no_header', names=['X', 'Y', 'Flux', 'ID'])

# Output the first five rows to display the table format
coords_tab[0:5]
| X | Y | Flux | ID |
|---|---|---|---|
| float64 | float64 | float64 | int64 |
| 486.984 | 3.91527 | 6330.1 | 0 |
| 2079.01 | 3.93333 | 7025.01 | 1 |
| 3365.99 | 4.92493 | 6264.28 | 2 |
| 2935.1 | 5.00032 | 10566.8 | 3 |
| 471.271 | 5.04838 | 24495.6 | 4 |
Now read in the FITS image. This step will be used for demonstrative plots and is not necessary to run TweakReg.
data = fits.getdata('jcdua3f4q_flc.fits', 1)
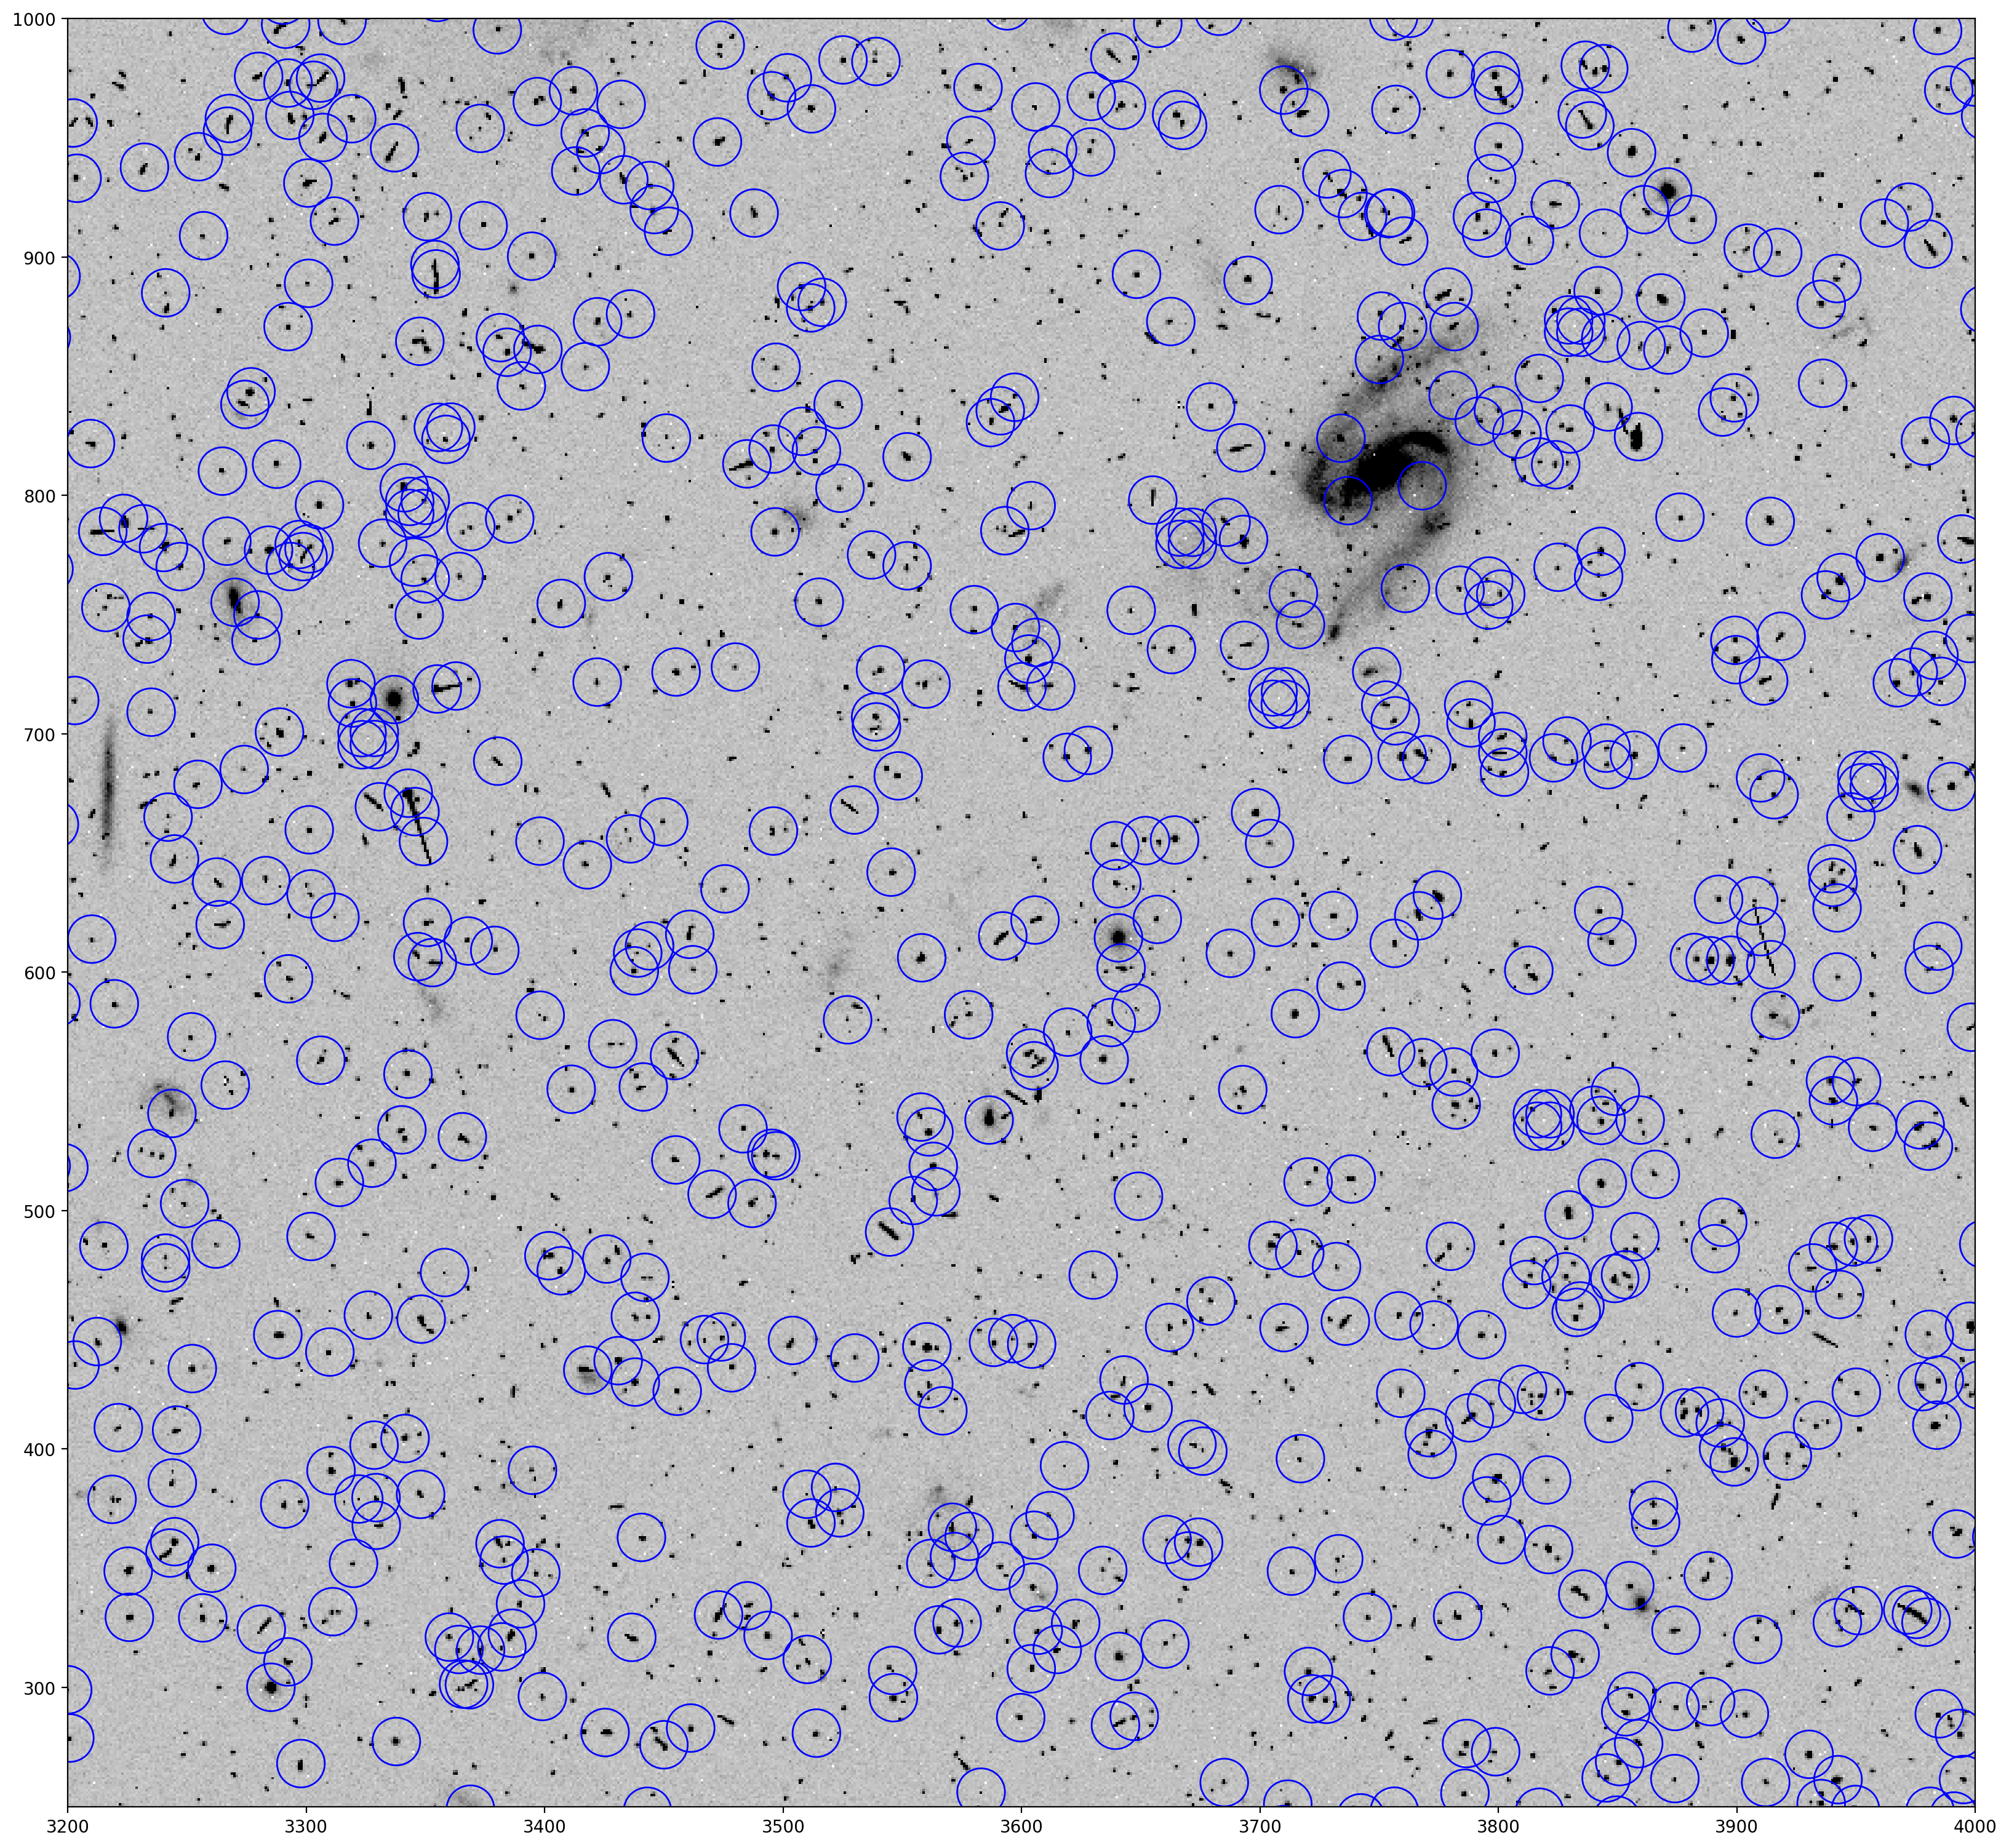
Then use photutils to generate apertures in order to display the source catalog positions detected by TweakReg on the FITS image. A fair number of spurious detections are found, but these are generally cosmic-rays which fall in random positions across the detector and will therefore not make it through into the matched catalogs (frame to frame).
Note: This step may take a few seconds to run due to the large number of apertures plotted.
# Make the apertures with photutils.
# One pixel offset corrects for differences between (0,0) and (1,1) origin systems.
positions = [(x-1., y-1.)
             for x, y in coords_tab.group_by(['X', 'Y']).groups.keys]
apertures = CircularAperture(positions, r=10.)

# Plot a region of the image with pyplot
plt.imshow(data, cmap='Greys', origin='lower', vmin=0, vmax=400)
plt.axis([3200, 4000, 250, 1000])

# Overplot the apertures onto the image
apertures.plot(color='blue', lw=1)
plt.show()
3. DS9 Regions in TweakReg#
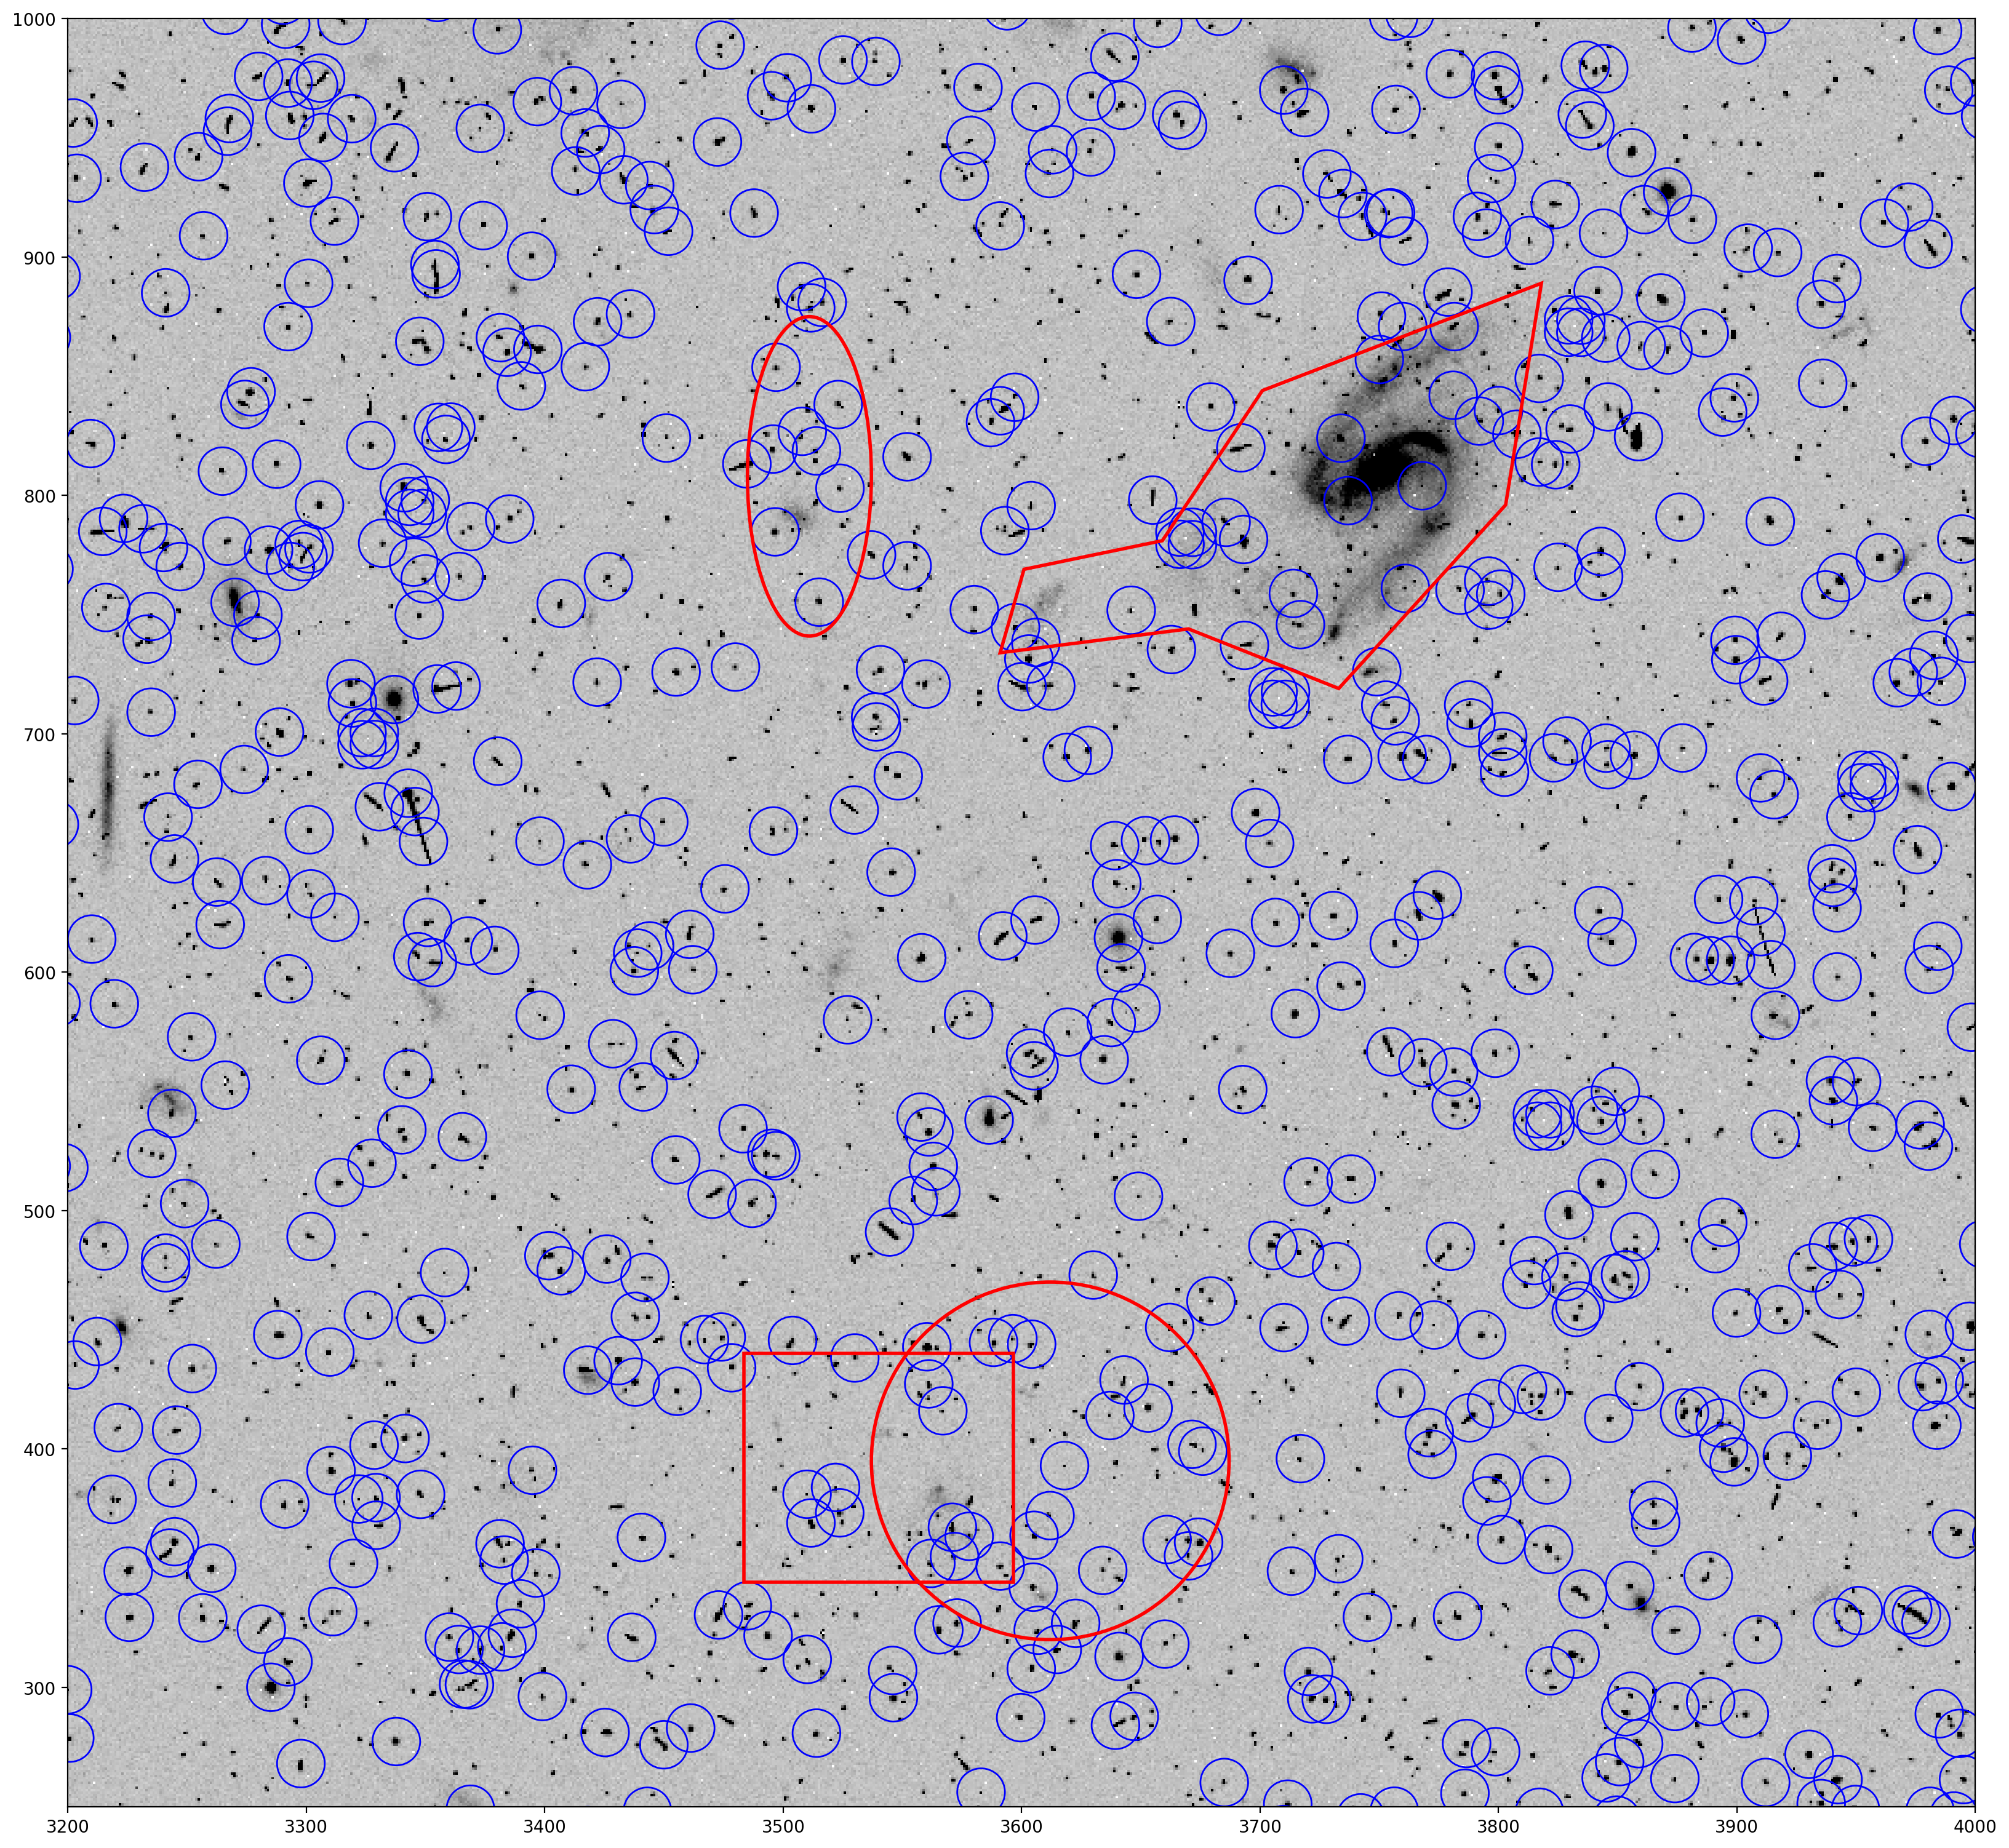
TweakReg allows the following DS9 region shapes: circle, ellipse, polygon, and box. All other shapes are ignored. All region files must comply with the DS9 region file format and all regions must be provided in image coordinates.
This demonstration uses one of each type of shape possible. In the region file, they look like this (in image coordinates):
polygon(3702,845,3819,890,3804,797,3734,720,3671,745,3592,735,3602,770,3660,782)
ellipse(3512,809,26,67,0)
circle(3613,396,75)
box(3541,393,113,96,0)
Next the DS9 regions are read in and parsed with the astropy regions package and then added to the plot to show how they look on the image.
# Read in and parse the DS9 region file with the regions package
ds9_regions_file = 'jcdua3f4q_sci1_exclude.reg'
regions = Regions.read(ds9_regions_file)

# Plot previous figure with DS9 region shapes
fig, ax = plt.subplots()
ax.imshow(data, cmap='Greys', origin='lower', vmin=0, vmax=400)
ax.axis([3200, 4000, 250, 1000])
apertures.plot(color='blue', lw=1.)
for regs in range(4):
    regions[regs].plot(ax=ax, edgecolor='red', lw=2, fill=False)
plt.show()
You can see the polygon outlining a galaxy, including the extended tidal stream. The other shapes are placed randomly as demonstration.
This figure will be remade several times with different TweakReg outputs, so a function has been defined below to automatically read in the TweakReg source catalog and reproduce this figure.
# Define a function to remake this figure after subsequent TweakReg runs.
def read_tweak_cat_and_plot():
    '''
    This function reads in the TweakReg coordinate catalog for
    SCI1 of image JCDUA3F4Q, creates apertures for all the sources
    detected, then plots the apertures on the FITS image along
    with the DS9 region files defined previously in the notebook.
    '''

    # Read in the SCI1 catalog file with the exclusions
    coords_tab = Table.read('jcdua3f4q_flc_sci1_xy_catalog.coo',
                            format='ascii.no_header',
                            names=['X', 'Y', 'Flux', 'ID'])

    # Define apertures for TweakReg identified sources
    positions = [(x-1., y-1.)
                 for x, y in coords_tab.group_by(['X', 'Y']).groups.keys]
    apertures = CircularAperture(positions, r=10.)

    # Plot
    fig, ax = plt.subplots()
    ax.imshow(data, cmap='Greys', origin='lower', vmin=0, vmax=400)
    ax.axis([3200, 4000, 250, 1000])
    apertures.plot(color='blue', lw=1.)
    for regs in range(4):
        regions[regs].plot(ax=ax, edgecolor='red', lw=2, fill=False)
    plt.show()
4. Exclusion regions#
TweakReg identifies the DS9 region files from a plain text file provided to the exclusions parameter. This text file must give the filename of the images and the name of the DS9 region files that should be applied to the SCI1 and SCI2 extensions, respectively. The format is important, and for our example would look like:
jcdua3f4q_flc.fits jcdua3f4q_sci1_exclude.reg None
jcdua3f8q_flc.fits None None
‘None’ serves the function of an empty placeholder. Since the exclusions are applied only to SCI1, the syntax can be simplified to the following.
jcdua3f4q_flc.fits jcdua3f4q_sci1_exclude.reg
jcdua3f8q_flc.fits
NOTE: If an image needs DS9 regions applied to the SCI2 extension only, then ‘None’ must be written after the filename and before the SCI2 region.
The git repo for this notebook contains a file exclusions.txt to use as input to TweakReg.
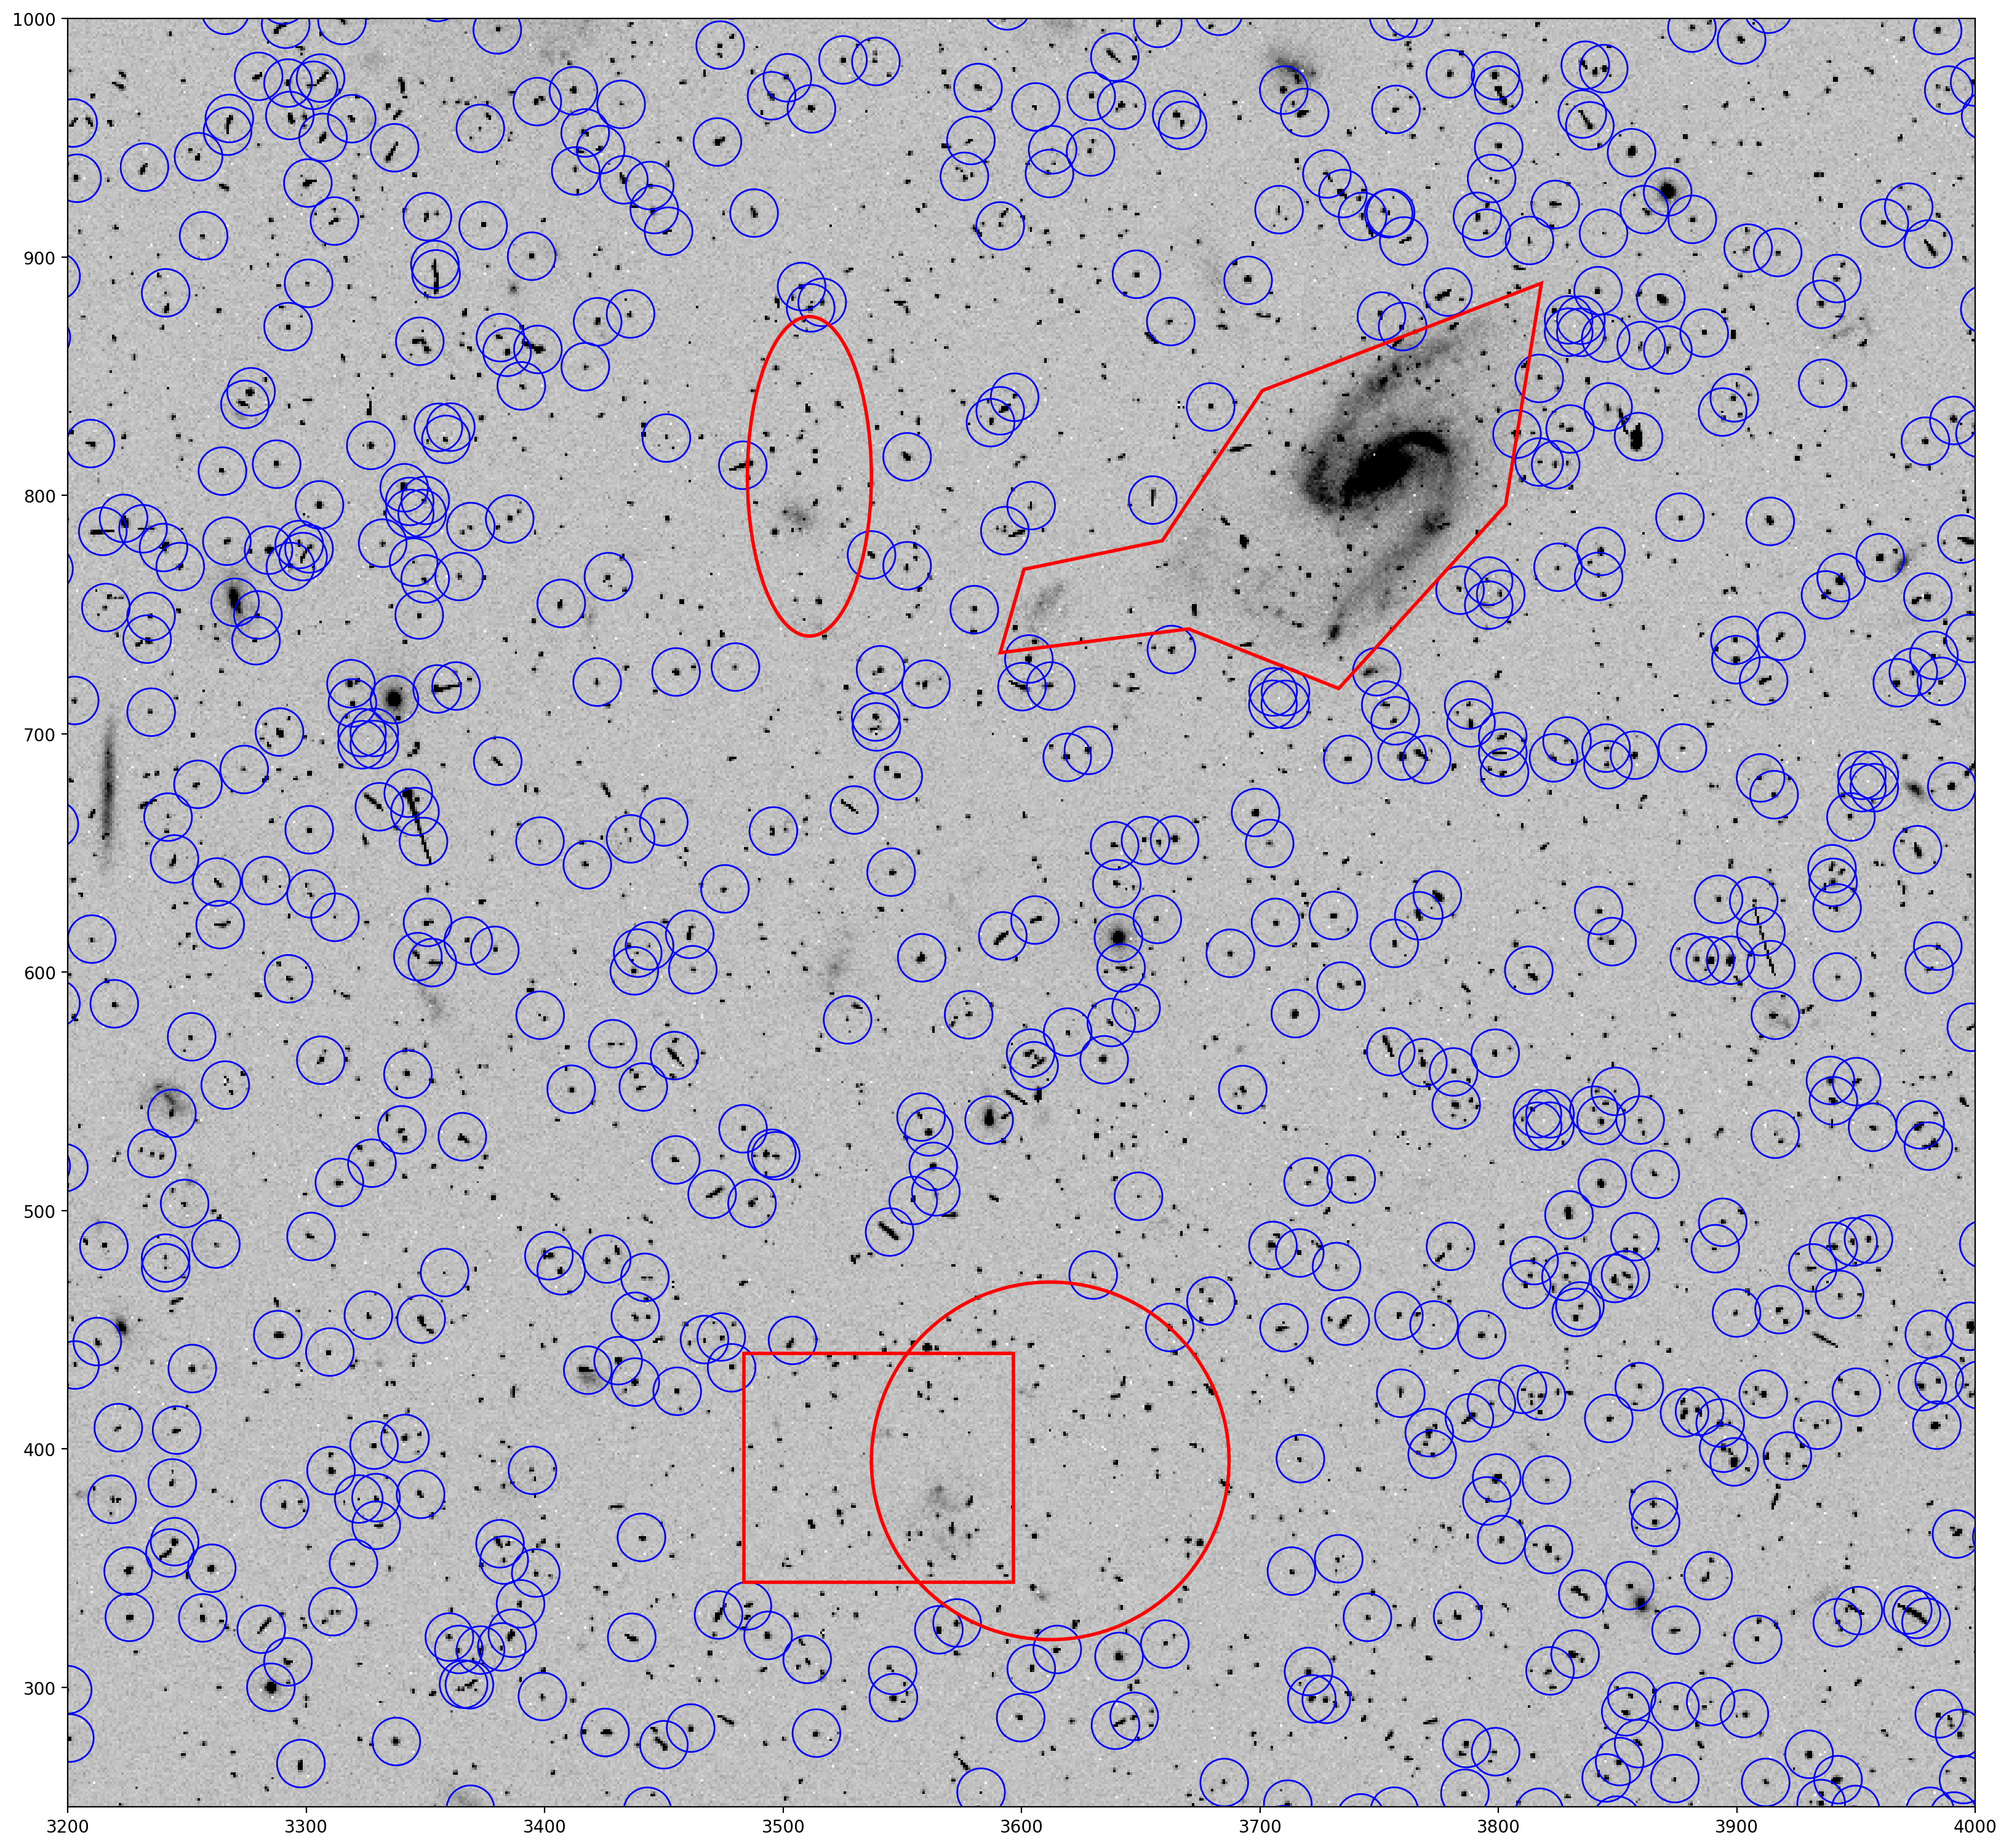
To exclude the sources within a DS9 region shape, a minus sign (-) is put before the shape. This time, all four shapes will be exluded from source detection. The corresponding DS9 region jcdua3f4q_sci1_exclude.reg therefore has the syntax:
# Region file format: DS9 version 4.1
global color=yellow dashlist=8 3 width=2 font="helvetica 10 normal roman"
select=1 highlite=1 dash=0 fixed=0 edit=1 move=1 delete=1 include=1 source=1
image
-polygon(3702,845,3819,890,3804,797,3734,720,3671,745,3592,735,3602,770,3660,782)
-ellipse(3512,809,26,67,0)
-circle(3613,396,75)
-box(3541,393,113,96,0)
Now TweakReg is run again, this time with the DS9 regions provided by the exclusions parameter.
# tweakreg run with DS9 regions excluded from source detection
tweakreg.TweakReg('jcdua3f4q_flc.fits',
                  imagefindcfg=dict(threshold=50, conv_width=4.5),
                  exclusions='exclusions.txt',
                  updatehdr=False)
Setting up logfile : tweakreg.log
TweakReg Version 3.10.0 started at: 20:21:13.655 (02/12/2025)
Version Information
--------------------
Python Version 3.11.14 | packaged by conda-forge | (main, Oct 22 2025, 22:46:25) [GCC 14.3.0]
numpy Version -> 2.3.5
astropy Version -> 7.2.0
stwcs Version -> 1.7.5
photutils Version -> 2.3.0
jcdua3f4q_flc.fits
jcdua3f8q_flc.fits
Finding shifts for:
jcdua3f4q_flc.fits
=== Source finding for image 'jcdua3f4q_flc.fits':
# Source finding for 'jcdua3f4q_flc.fits', EXT=('SCI', 1) started at: 20:21:13.736 (02/12/2025)
Found 10273 objects.
# Source finding for 'jcdua3f4q_flc.fits', EXT=('SCI', 2) started at: 20:21:15.560 (02/12/2025)
Found 10638 objects.
=== FINAL number of objects in image 'jcdua3f4q_flc.fits': 20911
WARNING: Fewer than two images available for alignment. Quitting...
Trailer file written to: tweakreg.log
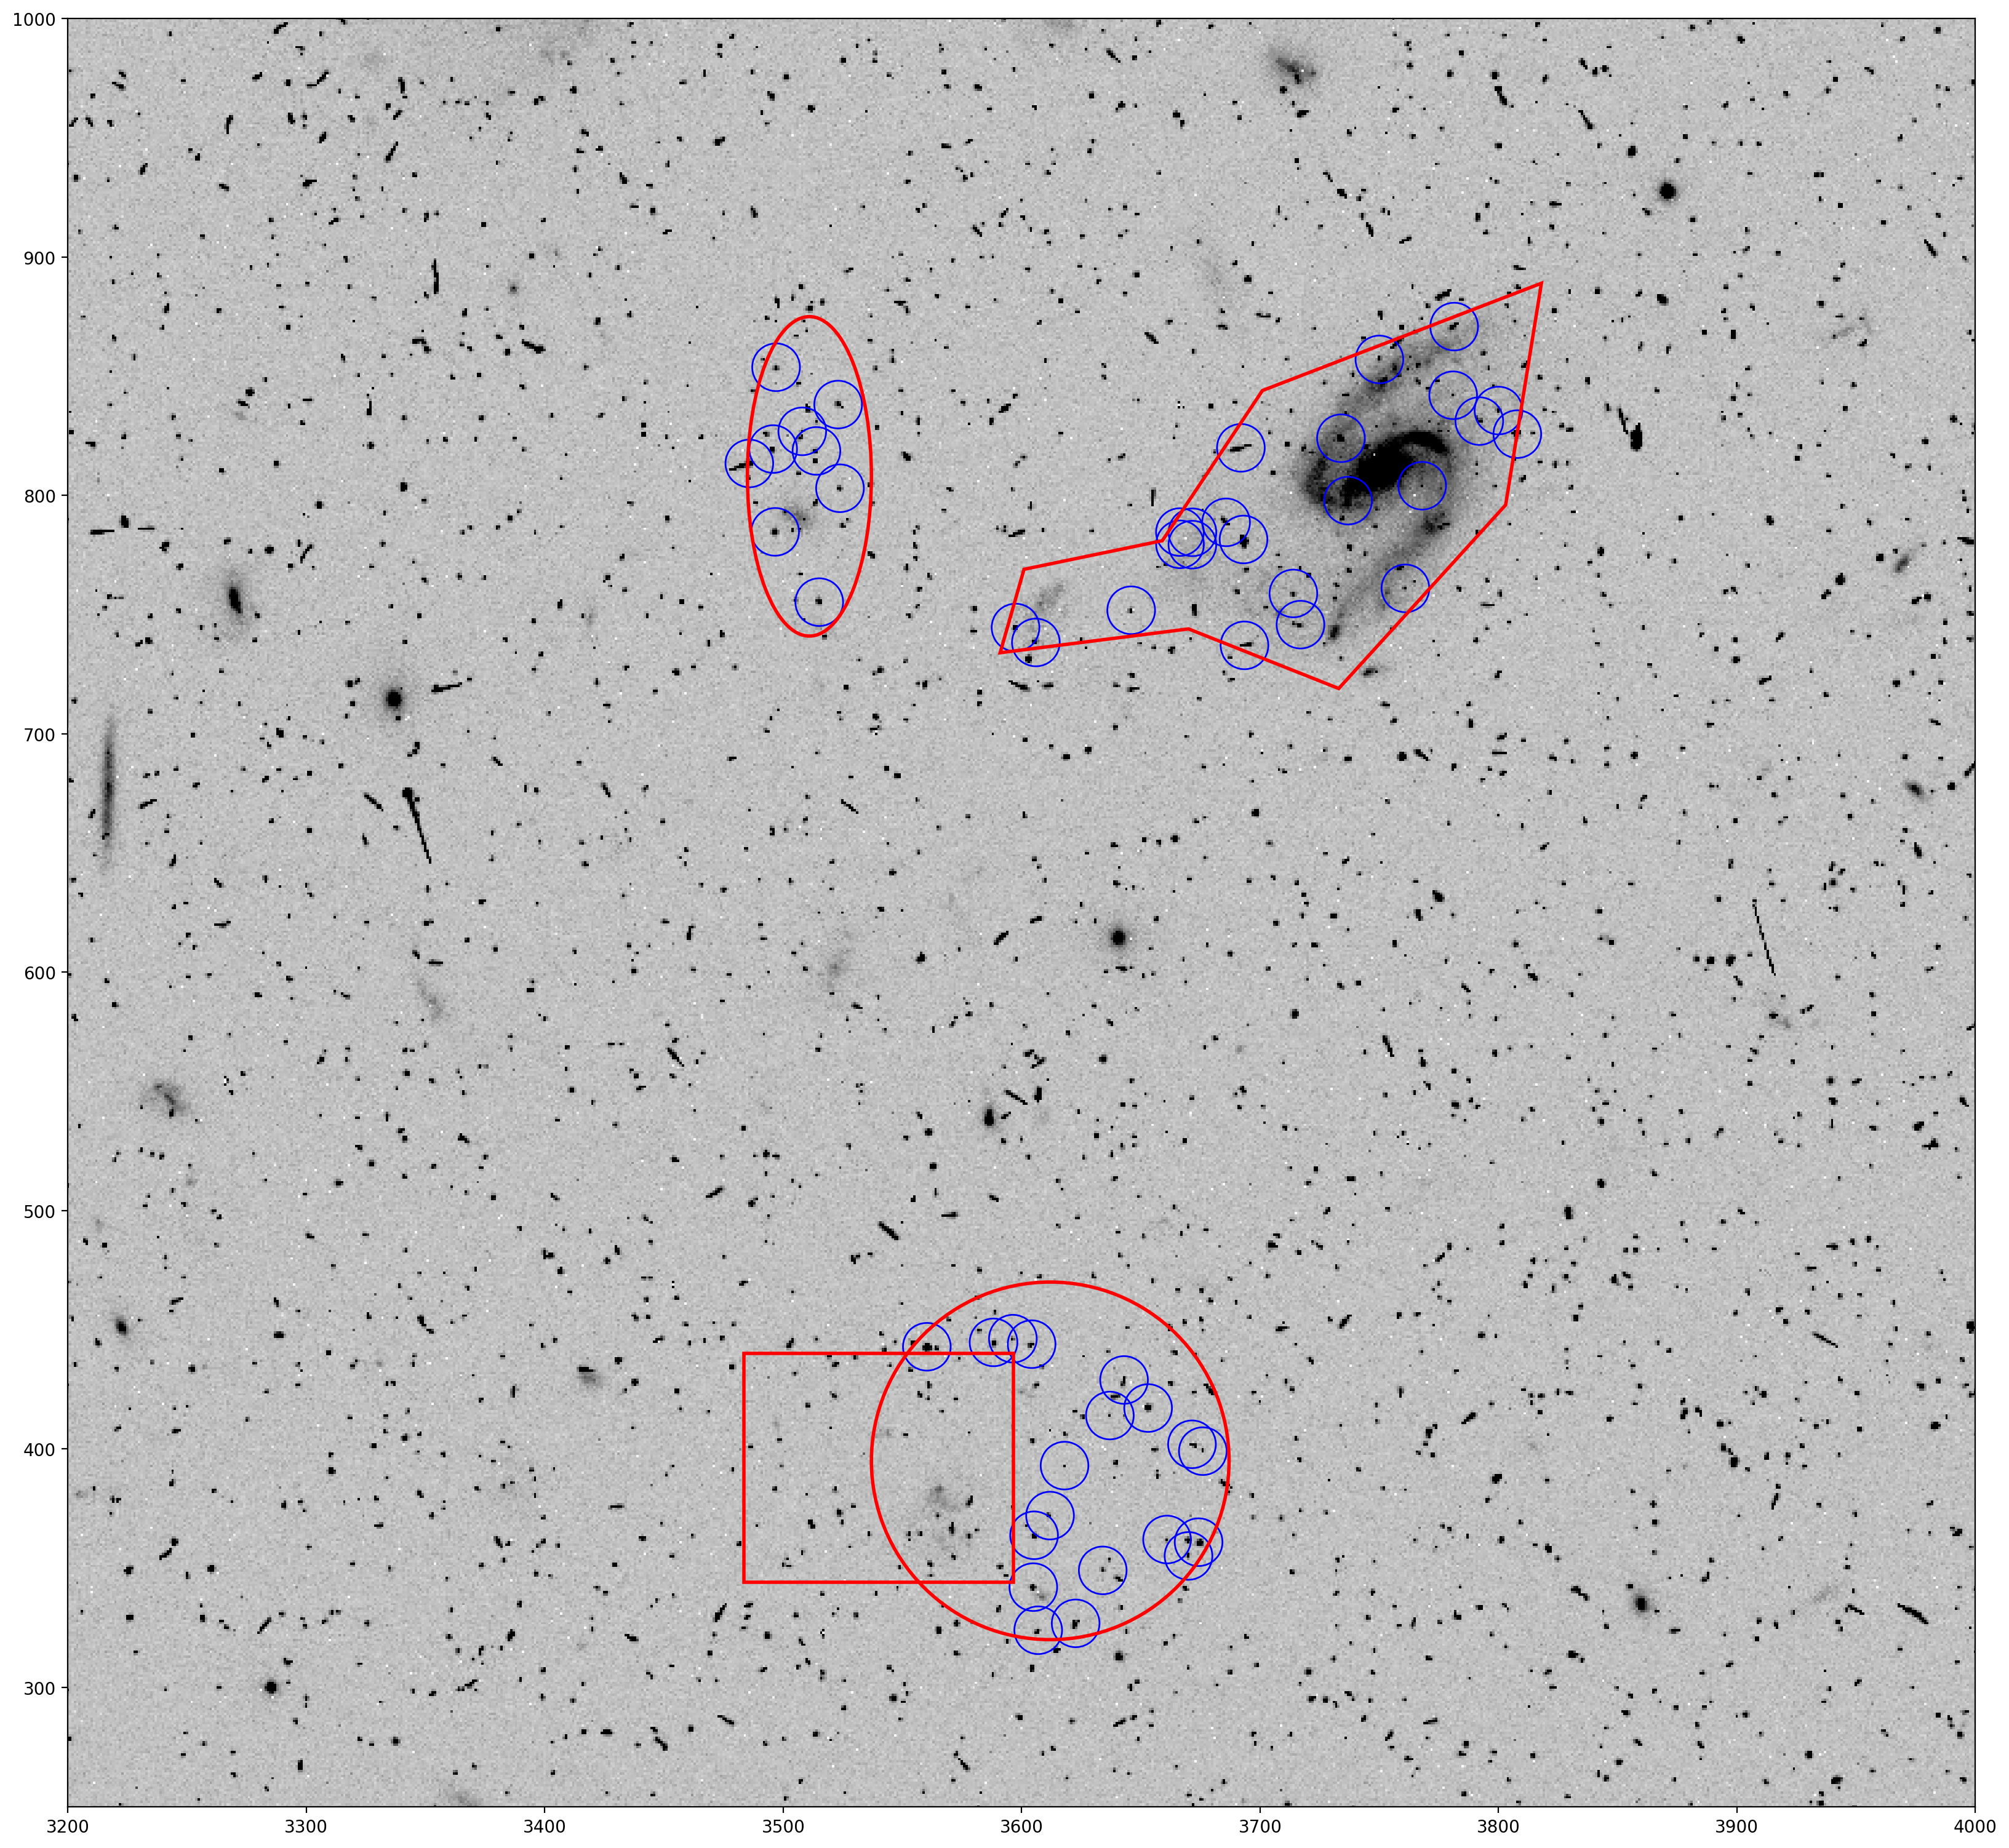
As expected, sources within the defined DS9 exlusion regions are no longer in the TweakReg source catalog.
5. Inclusion Regions#
Now we will look at inclusions, where only sources inside the DS9 regions are detected by TweakReg. The exclusions parameter name doesn’t change, but in this example we give it inclusions.txt now instead.
jcdua3f4q_flc.fits jcdua3f4q_sci1_include.reg
jcdua3f8q_flc.fits
From the information from the last section, the file syntax indicates that jcdua3f4q_sci1_include.reg is applied to the SCI1 extention of jcdua3f4q_flc.fits, and no DS9 regions are given for the SCI2 extention, or for the second image jcdua3f8q_flc.fits.
Looking at jcdua3f4q_sci1_include.reg, it shows the same shapes as before, but the minus signs (-) at the beginning of the lines are removed.
# Region file format: DS9 version 4.1
global color=yellow dashlist=8 3 width=2 font="helvetica 10 normal roman"
select=1 highlite=1 dash=0 fixed=0 edit=1 move=1 delete=1 include=1 source=1
image
polygon(3702,845,3819,890,3804,797,3734,720,3671,745,3592,735,3602,770,3660,782)
ellipse(3512,809,26,67,0)
circle(3613,396,75)
box(3541,393,113,96,0)
There is no symbol associated with inclusion regions. If there is no symbol before the shape, then it is treated as an inclusion region. If there is a minus sign (-), then it is treated as an exclusion region.
# tweakreg run with source detection only inside the DS9 regions
tweakreg.TweakReg('jcdua3f4q_flc.fits',
                  imagefindcfg=dict(threshold=50, conv_width=4.5),
                  exclusions='inclusions.txt',
                  updatehdr=False)
Setting up logfile : tweakreg.log
TweakReg Version 3.10.0 started at: 20:21:39.574 (02/12/2025)
Version Information
--------------------
Python Version 3.11.14 | packaged by conda-forge | (main, Oct 22 2025, 22:46:25) [GCC 14.3.0]
numpy Version -> 2.3.5
astropy Version -> 7.2.0
stwcs Version -> 1.7.5
photutils Version -> 2.3.0
jcdua3f4q_flc.fits
jcdua3f8q_flc.fits
Finding shifts for:
jcdua3f4q_flc.fits
=== Source finding for image 'jcdua3f4q_flc.fits':
# Source finding for 'jcdua3f4q_flc.fits', EXT=('SCI', 1) started at: 20:21:39.65 (02/12/2025)
Found 63 objects.
# Source finding for 'jcdua3f4q_flc.fits', EXT=('SCI', 2) started at: 20:21:40.574 (02/12/2025)
Found 10638 objects.
=== FINAL number of objects in image 'jcdua3f4q_flc.fits': 10701
WARNING: Fewer than two images available for alignment. Quitting...
Trailer file written to: tweakreg.log
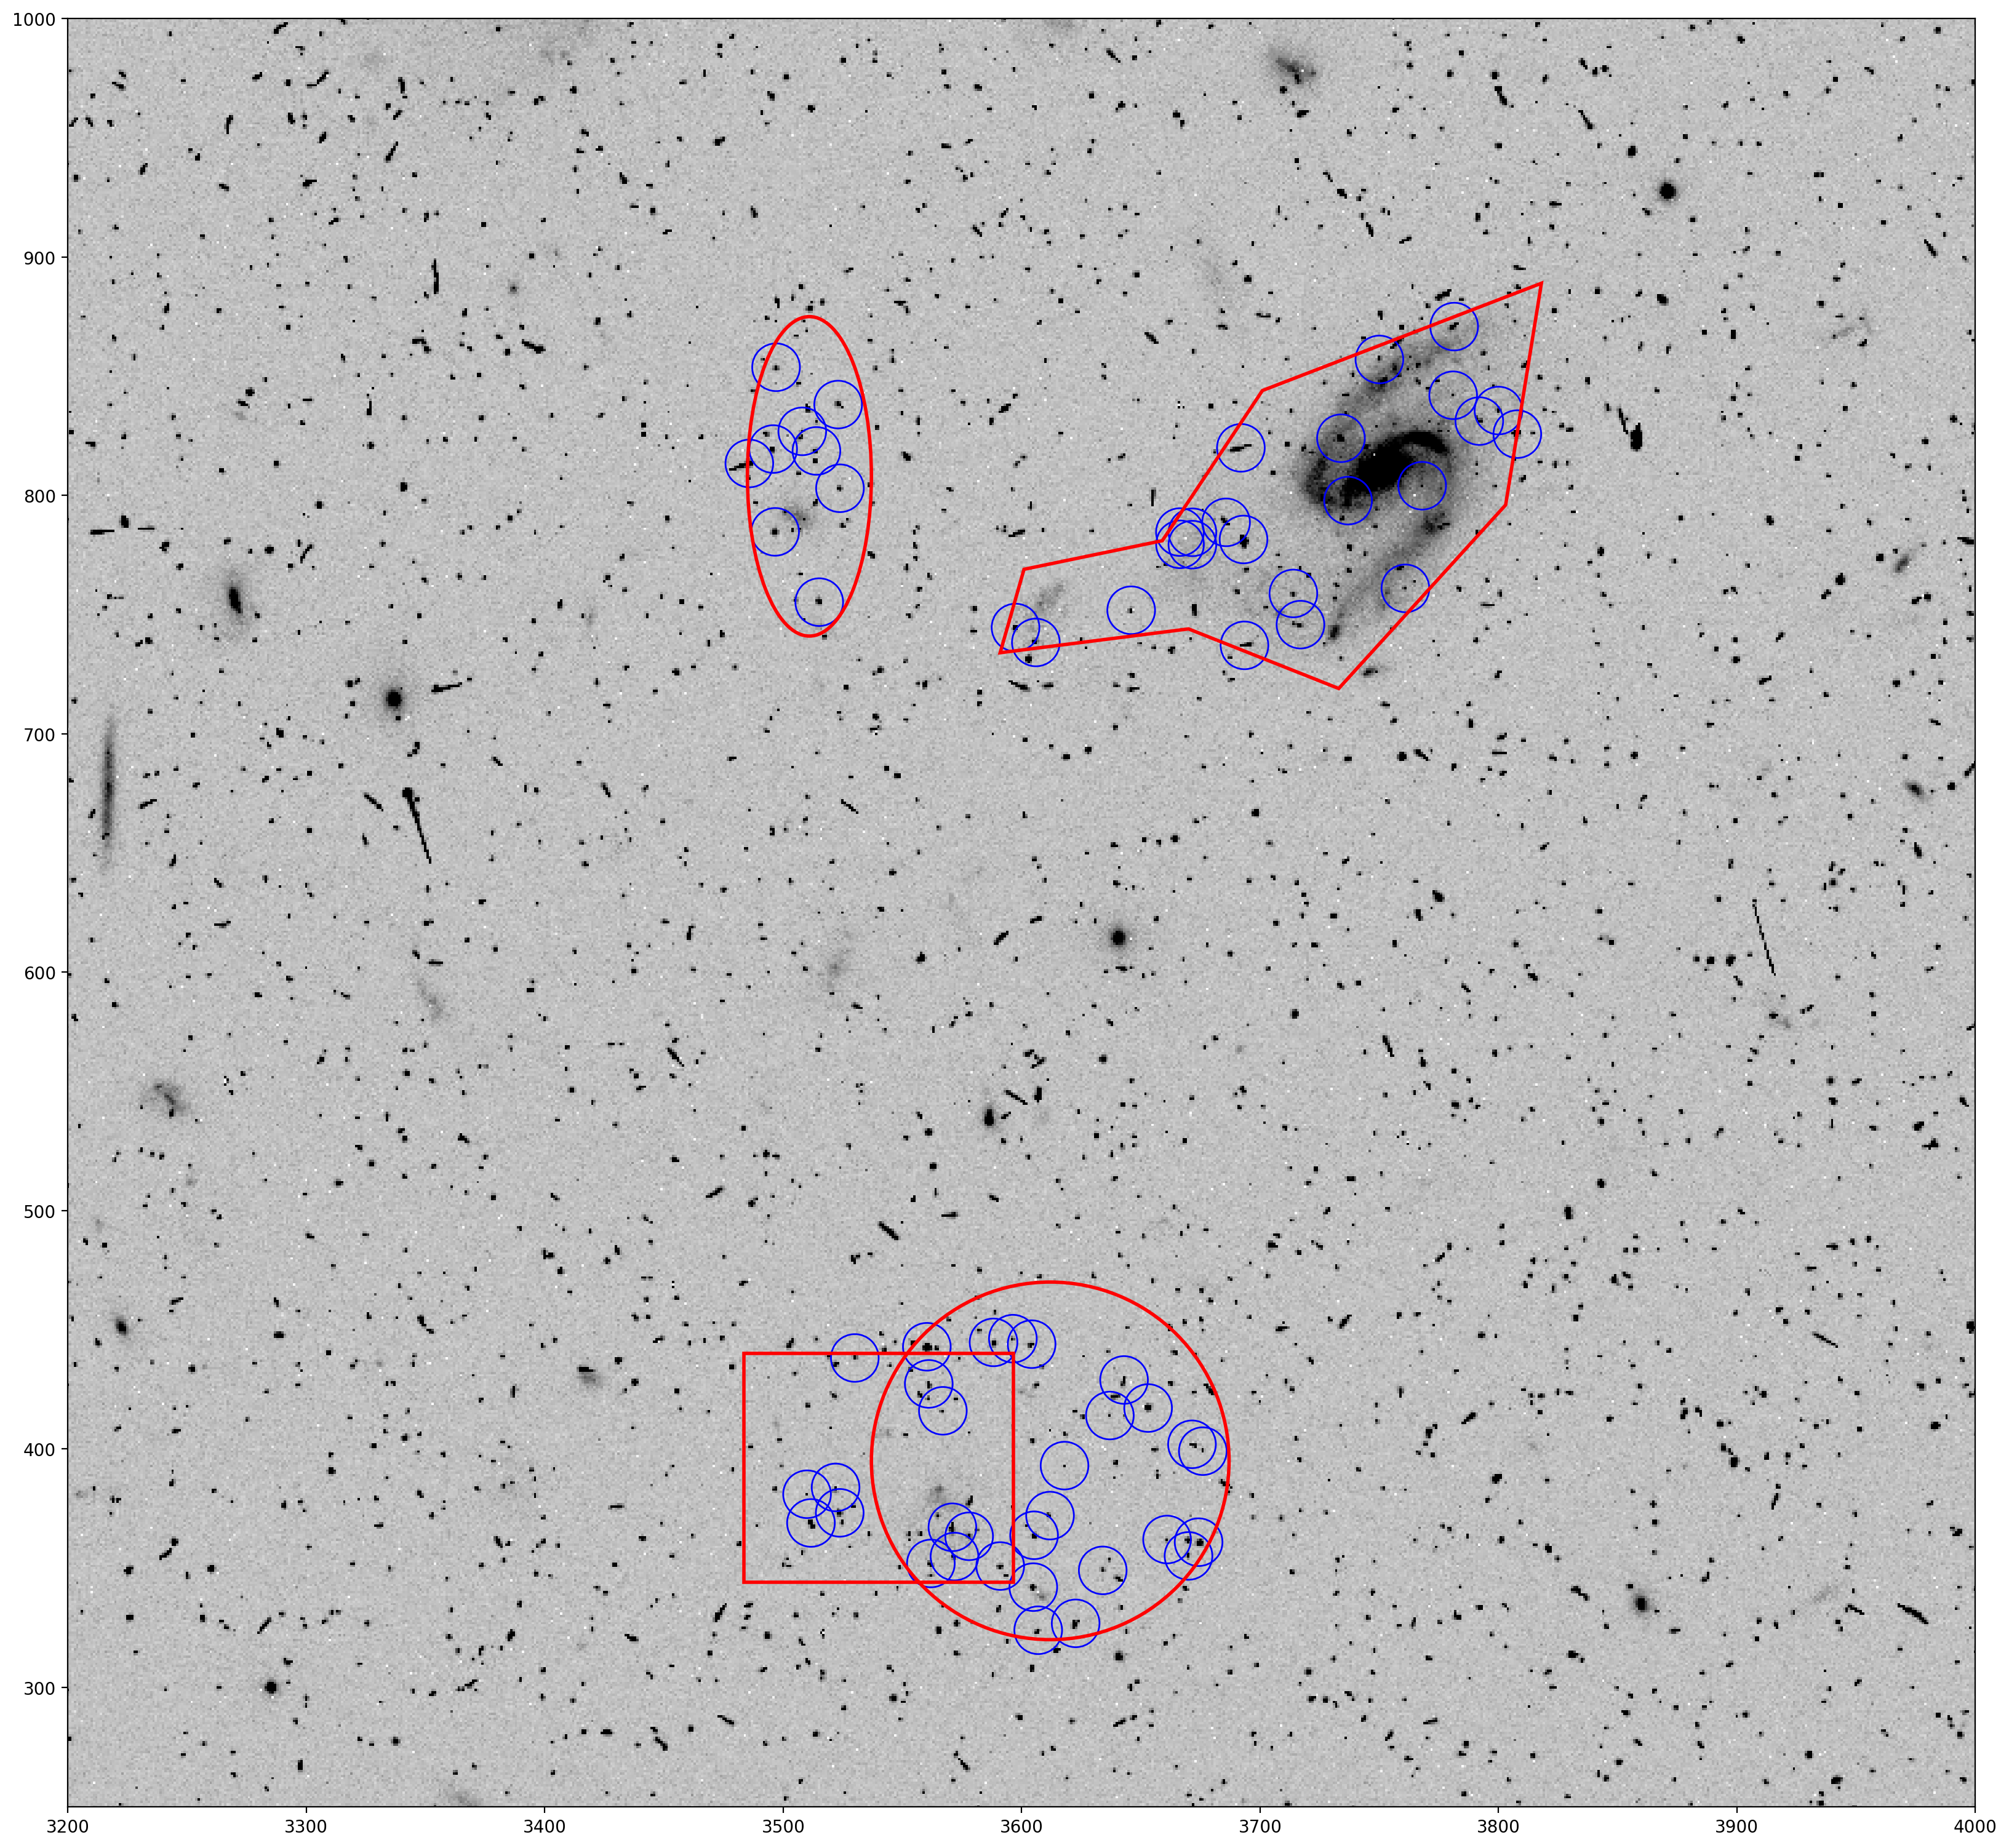
This shows that only sources in the DS9 regions are included in the TweakReg source catalog. Note that only \(\approx60\) objects were found by TweakReg for SCI1, compared to \(\approx10,000\) found in the original catalog. The number of objects for SCI2 is unchanged.
6. Combining Exclusion and Inclusion Regions#
The inclusion and exclusion regions can be used at the same time. For this example, the inclusions_no_box.txt file is fed to the exclusions parameter in TweakReg.
jcdua3f4q_flc.fits jcdua3f4q_sci1_include_no_box.reg
jcdua3f8q_flc.fits
jcdua3f4q_sci1_include_no_box.reg has only a minus sign (-) on the last line.
# Region file format: DS9 version 4.1
global color=yellow dashlist=8 3 width=2 font="helvetica 10 normal roman"
select=1 highlite=1 dash=0 fixed=0 edit=1 move=1 delete=1 include=1 source=1
image
polygon(3702,845,3819,890,3804,797,3734,720,3671,745,3592,735,3602,770,3660,782)
ellipse(3512,809,26,67,0)
circle(3613,396,75)
-box(3541,393,113,96,0)
This means that all the shapes will be treated as inclusion regions except for the box, which will be excluded from the source detection.
# tweakreg run with a mix of included/excluded DS9 regions
tweakreg.TweakReg('jcdua3f4q_flc.fits',
                  imagefindcfg=dict(threshold=50, conv_width=4.5),
                  exclusions='inclusions_no_box.txt',
                  updatehdr=False)
Setting up logfile : tweakreg.log
TweakReg Version 3.10.0 started at: 20:21:42.476 (02/12/2025)
Version Information
--------------------
Python Version 3.11.14 | packaged by conda-forge | (main, Oct 22 2025, 22:46:25) [GCC 14.3.0]
numpy Version -> 2.3.5
astropy Version -> 7.2.0
stwcs Version -> 1.7.5
photutils Version -> 2.3.0
jcdua3f4q_flc.fits
jcdua3f8q_flc.fits
Finding shifts for:
jcdua3f4q_flc.fits
=== Source finding for image 'jcdua3f4q_flc.fits':
# Source finding for 'jcdua3f4q_flc.fits', EXT=('SCI', 1) started at: 20:21:42.554 (02/12/2025)
Found 51 objects.
# Source finding for 'jcdua3f4q_flc.fits', EXT=('SCI', 2) started at: 20:21:43.442 (02/12/2025)
Found 10638 objects.
=== FINAL number of objects in image 'jcdua3f4q_flc.fits': 10689
WARNING: Fewer than two images available for alignment. Quitting...
Trailer file written to: tweakreg.log
This shows the sources detected within the inclusion regions except for those excluded from the box.
NOTE: The order of the DS9 regions is important!
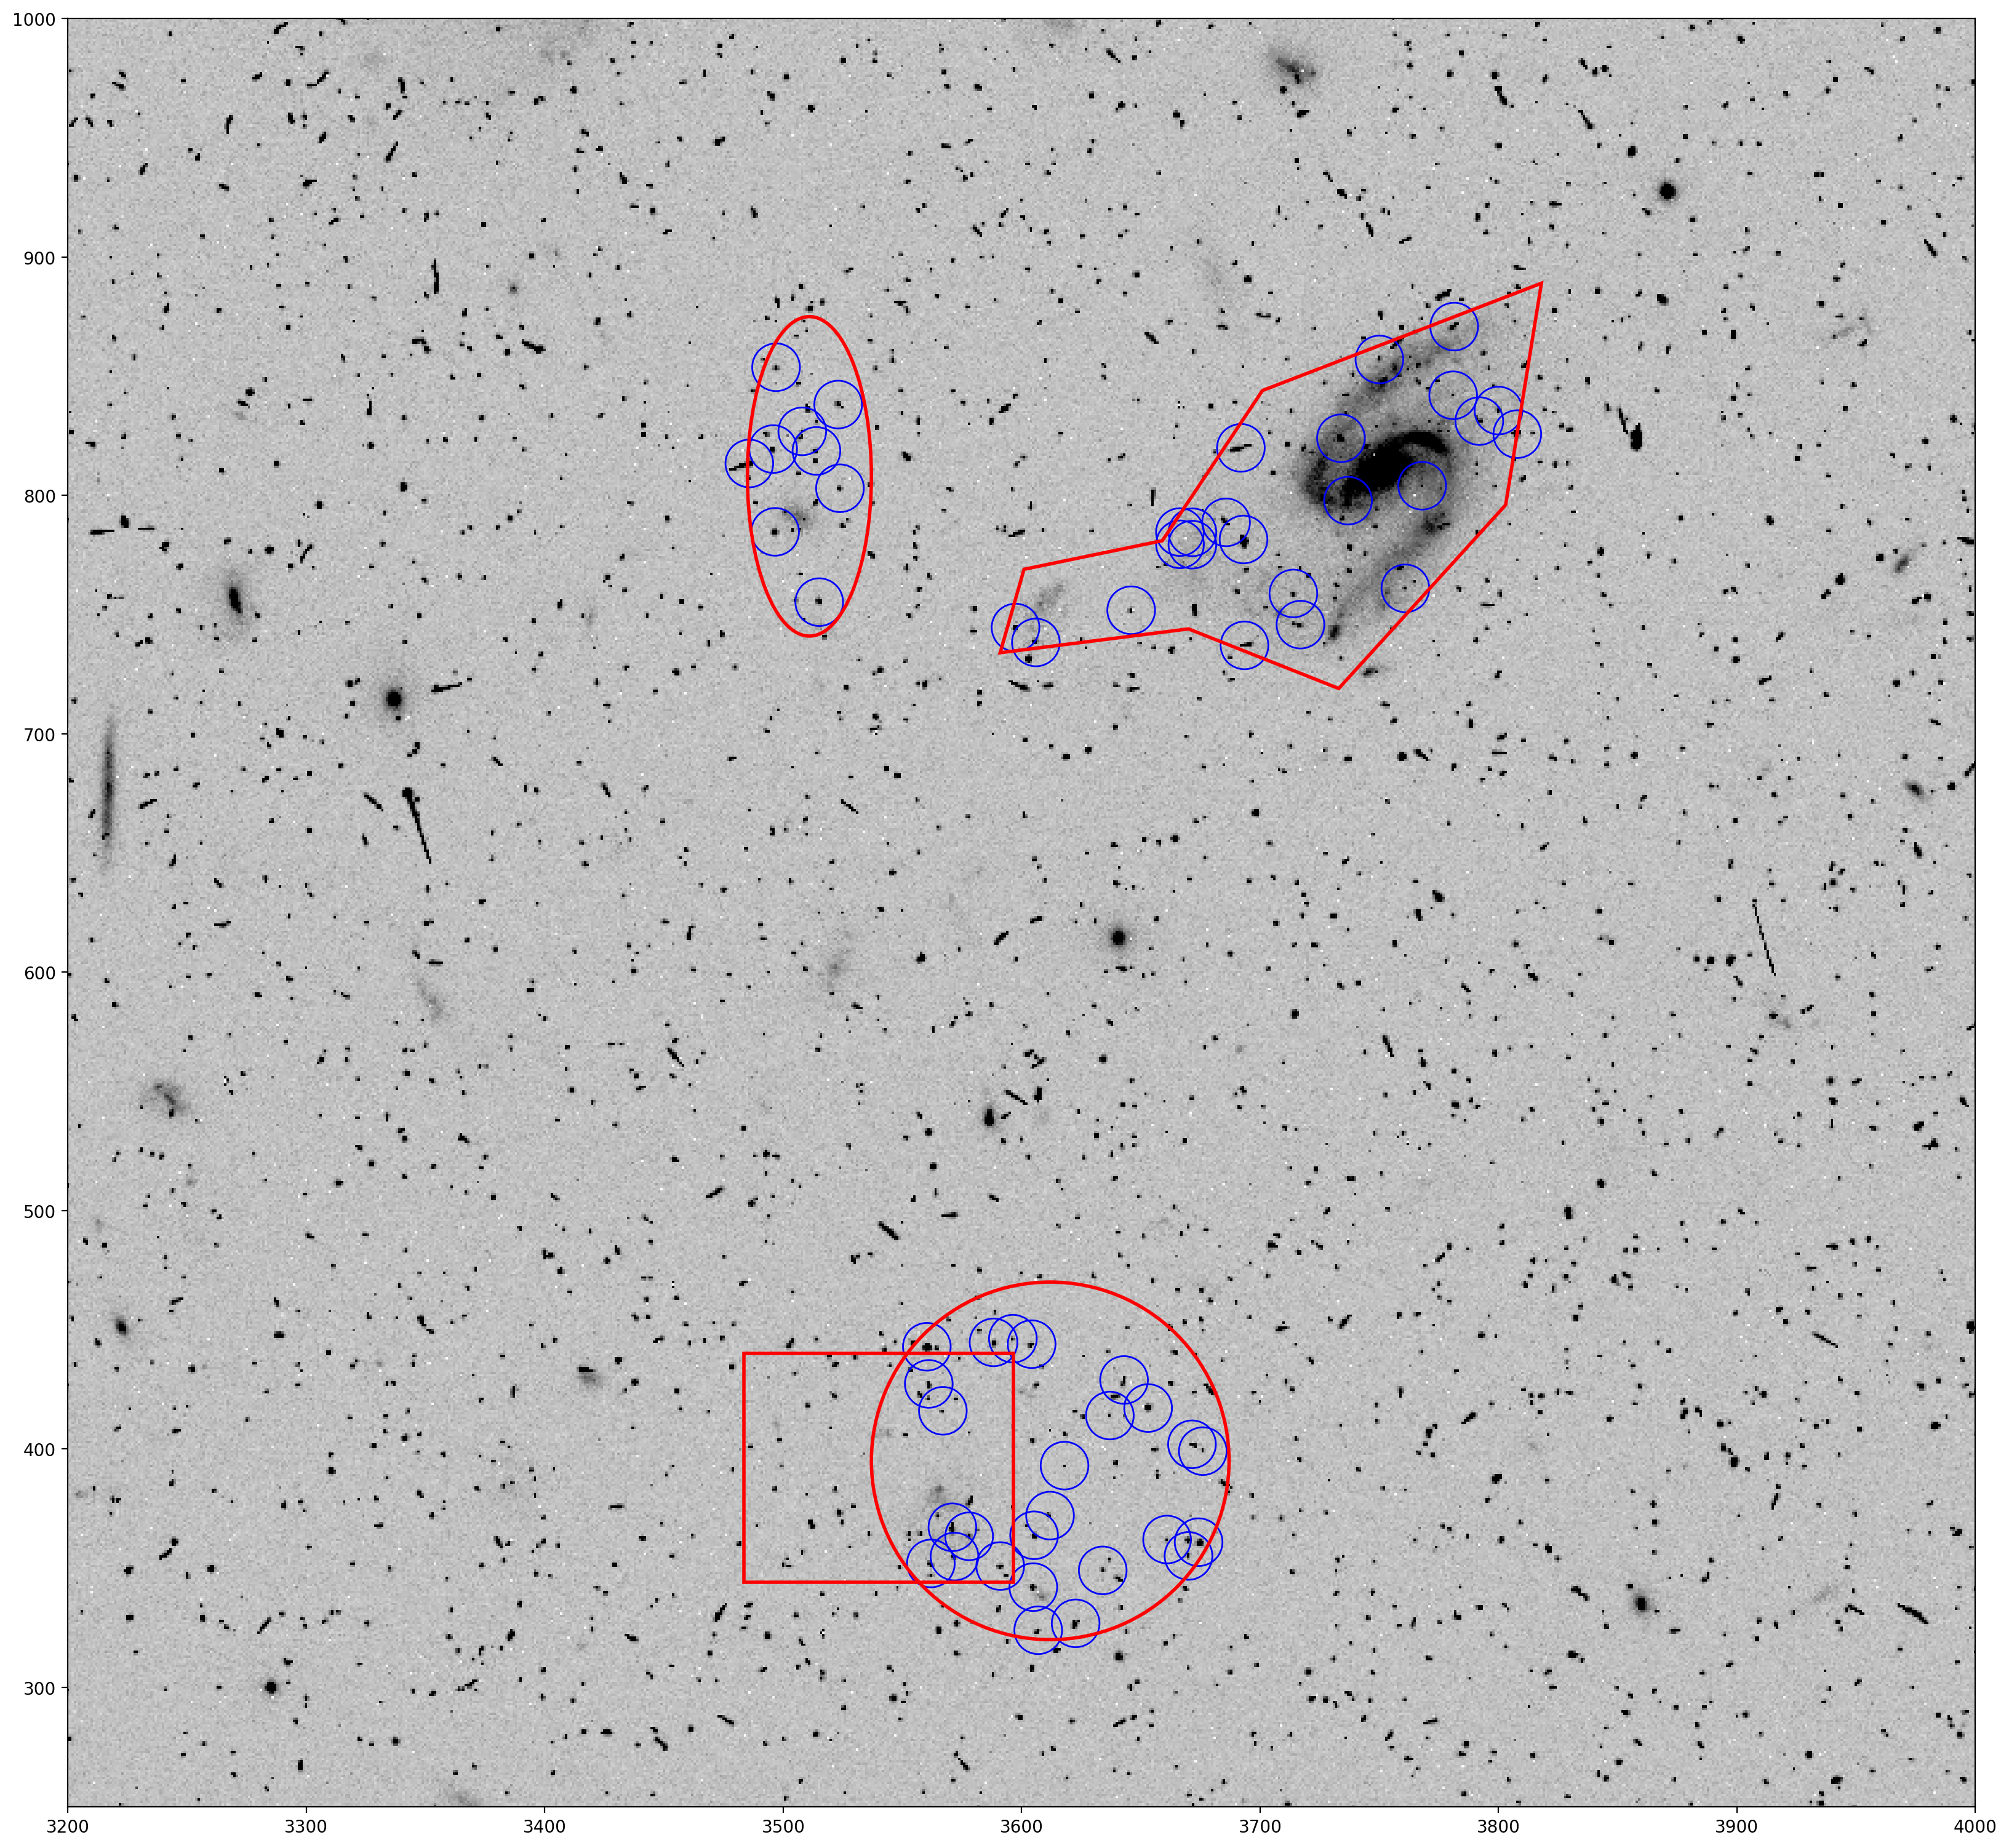
TweakReg applies the DS9 region requirements in the order in which they appear in the DS9 region file. To demonstrate this, the excluded box shape is moved to the beginning of the region list, so that it is the first processed instead of the last. This is seen by inputing inclusions_no_box_first.txt which specifies the region file jcdua3f4q_sci1_include_no_box_first.reg:
# Region file format: DS9 version 4.1
global color=yellow dashlist=8 3 width=2 font="helvetica 10 normal roman"
select=1 highlite=1 dash=0 fixed=0 edit=1 move=1 delete=1 include=1 source=1
image
-box(3541,393,113,96,0)
polygon(3702,845,3819,890,3804,797,3734,720,3671,745,3592,735,3602,770,3660,782)
ellipse(3512,809,26,67,0)
circle(3613,396,75)
# tweakreg run with excluded box first to show order of operations
tweakreg.TweakReg('jcdua3f4q_flc.fits',
                  imagefindcfg=dict(threshold=50, conv_width=4.5),
                  exclusions='inclusions_no_box_first.txt',
                  updatehdr=False)
Setting up logfile : tweakreg.log
TweakReg Version 3.10.0 started at: 20:21:45.298 (02/12/2025)
Version Information
--------------------
Python Version 3.11.14 | packaged by conda-forge | (main, Oct 22 2025, 22:46:25) [GCC 14.3.0]
numpy Version -> 2.3.5
astropy Version -> 7.2.0
stwcs Version -> 1.7.5
photutils Version -> 2.3.0
jcdua3f4q_flc.fits
jcdua3f8q_flc.fits
Finding shifts for:
jcdua3f4q_flc.fits
=== Source finding for image 'jcdua3f4q_flc.fits':
# Source finding for 'jcdua3f4q_flc.fits', EXT=('SCI', 1) started at: 20:21:45.378 (02/12/2025)
Found 58 objects.
# Source finding for 'jcdua3f4q_flc.fits', EXT=('SCI', 2) started at: 20:21:46.253 (02/12/2025)
Found 10638 objects.
=== FINAL number of objects in image 'jcdua3f4q_flc.fits': 10696
WARNING: Fewer than two images available for alignment. Quitting...
Trailer file written to: tweakreg.log
Now the circle is given precedence because it is the last region shape processed, and therefore the section of overlap with the box is not removed as it was in the previous figure.
Due to this behavior, remember to be careful with the order in the DS9 region file when combining inclusion and exclusion requirements.
7. Final Thoughts#
Once you are happy with the sources being used for alignment, TweakReg may be used to align the two HST images jcdua3f4q_flc.fits and jcdua3f8q_flc.fits to one another or to an external reference catalog. For more information, see the alignment notebooks in this repository.
About this Notebook#
Created: 14 Dec 2018; S. Hoffmann
Updated: 17 Jan 2024; F. Dauphin
         30 Apr 2024; R. Avila & J. Mack
Source: GitHub spacetelescope/hst_notebooks
Additional Resources#
Below are some additional resources that may be helpful. Please send any questions through the HST Help Desk, selecting the Drizzlepac category.
Citations#
If you use Python packages such as astropy, astroquery, drizzlepac, matplotlib, or numpy for published research, please cite the authors.
Follow these links for more information about citing various packages:


